Executive Summary
The Data Operating Model (DOM) at BMT provides a comprehensive and structured framework that supports strategic decision-making and operational efficiency across the organisation. Developed to enhance data accessibility, quality, governance, and scalability, the DOM plays a crucial role in enabling data-driven decision-making and aligning data practices with BMT’s core business objectives.
Key Objectives
The DOM is designed to:
- Centralise Data Access: Provide a unified repository for data that ensures consistency across departments.
- Enhance Data Quality and Reliability: Through robust governance and structured quality metrics, data integrity and accuracy are continuously upheld.
- Support Agile Decision-Making: A multi-layered medallion architecture provides tailored data views, making data more relevant and actionable.
- Promote Continuous Improvement: An adaptable and scalable model that aligns with evolving business and data needs.
Core Features
- Data Flow and Architecture: Using a medallion architecture, data is processed through four layers—Bronze (Raw Ingestion), Silver (Cleansing and Alignment), Gold (Department-Specific Views), and Platinum (Advanced Analytics). Each layer adds value and quality to the data, making it fit for diverse use cases, from basic reporting to advanced AI applications.
- Governance and Accountability: The DOM outlines a governance structure that includes roles for data stewards, specialists, and custodians, each responsible for maintaining data quality and compliance. This structure, supported by regular audits and feedback loops, ensures a high standard of accountability and continuous quality improvement.
- Integration with Business Processes: The DOM aligns with BMT’s key business processes, enhancing customer insights, streamlining operations, and driving innovation. Embedded security protocols ensure compliance and data privacy, while cloud-based infrastructure supports BMT’s sustainability targets by optimising resource usage.
- Scalability and Flexibility: The model is built to scale across regions and departments, incorporating new data sources with ease. Its adaptable structure supports both current and future analytics needs, allowing BMT to integrate emerging technologies and data sources seamlessly.
- Data Quality Standards and Dimensions: A rigorous framework ensures data is accurate, complete, consistent, timely, unique, and usable. These dimensions are assessed through specific metrics, providing a holistic approach to data quality management and aligning with BMT’s commitment to operational excellence.
Standard Operating Procedures (SOPs)
Integrated SOPs across all data lifecycle stages—from planning and acquisition to processing, publication, and archiving—ensure that data handling processes are standardised, efficient, and aligned with governance protocols. These SOPs provide clear guidelines on quality checks, data security, and user accessibility, forming the backbone of BMT’s data handling practices.
Continuous Improvement and Data Quality Initiatives
The DOM includes advanced DataOps and Data Observability tools to monitor and enhance data quality in real time. Using a CI/CD (Continuous Integration/Continuous Deployment) approach, automated testing and monitoring support consistent, reliable data processing. Decentralised data ownership through Data Mesh principles empowers departments to manage data while adhering to central governance, encouraging a collaborative data culture.
Performance Metrics
A balanced scorecard aligned with BMT’s strategic pillars monitors DOM performance, measuring data quality, operational efficiency, environmental impact, and innovation. These KPIs provide actionable insights that guide ongoing improvements in data management and governance.
Table of Contents
Purpose and Scope
The Data Operating Model (DOM) is designed to support BMT’s strategic objectives through a structured, high-quality data framework. It centralises, secures, and optimises data handling to enable agile, data-driven decision-making across BMT’s global operations. This model outlines how data is acquired, transformed, governed, and made accessible to provide a “single source of truth,” supporting consistent insights and fostering a culture of innovation and continuous improvement.
Objectives:
- Centralise Data for Consistent Insights: Unified data access through a single repository.
- Ensure Data Quality and Integrity: Structured governance to maintain data reliability.
- Support Timely, Actionable Insights: Multi-layered architecture for varied data needs.
- Enable Continuous Improvement: Adaptable design for evolving business and data needs.
Scope:
The DOM applies to data governance, architecture, integration, security, user accessibility, and data quality across BMT’s operational and strategic levels.
Integration with Business Processes
The DOM strategically integrates with BMT’s core business objectives, from customer insights and project tracking to continuous innovation and operational efficiency.
Enhancing Customer Insights: Consolidates customer data across touchpoints, enabling proactive service improvements.
Optimising Operational Efficiency: Real-time data access supports faster response times, streamlining workflows.
Driving Innovation: Supports advanced analytics for continuous product and service improvement.
Ensuring Security and Compliance: Embedded security protocols support data privacy, with audit logs ensuring transparency.
Supporting Environmental Goals: Cloud-based, resource-efficient architecture reduces energy consumption, supporting sustainability targets.
Adaptability and Scalability
The DOM is designed to evolve alongside BMT’s growing data needs, ensuring it can scale regionally, adopt new sources, and support advanced analytics as demand rises.
Regional and Departmental Scalability: Cloud-based infrastructure enables seamless expansion across geographic regions and departments.
Integration of New Data Sources: New sources are incorporated efficiently, with standardised ingestion to maintain quality.
Flexible for Evolving Analytics Needs: Supports advanced analytics through modular medallion architecture, allowing for easy integration of new analytical tools and capabilities.
Sustainable Resource Optimisation: Optimises data storage and processing to align with BMT’s environmental targets.
Key Performance Metrics and Success Indicators
The DOM includes a balanced scorecard that aligns with BMT’s strategic pillars, providing KPIs to measure success across quality, accessibility, and impact.
Data Quality Metrics: Consistency, accuracy, completeness, and timeliness checks.
Operational Efficiency Metrics: Data latency, accessibility rates, and system uptime.
Innovation & Growth Enablement: Number of advanced analytics models in use, speed of onboarding new data sources.
Environmental Impact Metrics: Reduction in redundant data processing, energy consumption in cloud storage.
Data Flow (and Medallion Architecture)
Data Operating Model
For BMT to remain competitive in a rapidly evolving technological landscape, it must be able to adapt quickly to insights and new developments. The modern enterprise data warehouse model within the DOM facilitates access to reliable, timely, and structured data insights, empowering informed decision-making. Key benefits include:
- Enhanced Data Governance: The model reduces data governance debt by implementing consistent policies and standards.
- Accelerated Speed to Value: Enables prompt access to accurate, timely data.
- Simplified Data Estate: Reduces complexity and democratizes access to data across BMT.
- Centralisation and Standardisation: Standardises disparate data sources for consistent insights.
- Reduced IT Support Costs: Resilient, future-proof solutions that require minimal maintenance.
- Developer-Friendly Environment: Supports efficient development practices that align with industry standards.
- Scalable for Future Needs: Accommodates expanding data requirements and emerging trends.
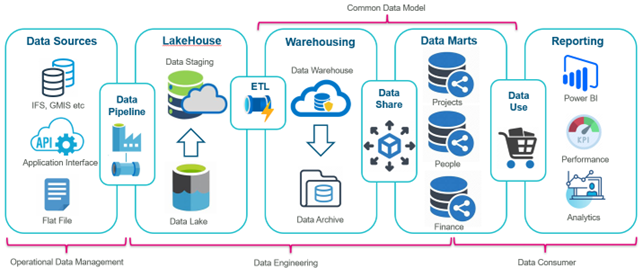
Medallion Architecture
To facilitate structured data processing and analysis, the DOM utilises a multi-layered medallion architecture, with each layer adding value to data through quality checks, governance protocols, and contextually relevant transformations.
Bronze Layer (Raw Data Ingestion)
Purpose: Ingest raw data from internal systems, external sources, and customer interactions.
Processes: Standardised ingestion protocols capture data in its native form, preserving its integrity.
Quality Focus: Initial data profiling and validation to eliminate redundancies early.
Silver Layer (Data Alignment and Cleansing)
Purpose: Transform raw data into a standard format aligned with BMT’s Common Data Model (CDM).
Processes: Apply cleansing, validation, and transformation processes to resolve discrepancies.
Quality Focus: Ensure accuracy, completeness, and consistency, making data fit for reporting.
Gold Layer (Enriched Data Marts)
Purpose: Aggregate data into subject-specific views for departmental access (e.g., Finance, HR, Operations).
Processes: Develop data marts tailored to specific business functions, enhancing usability and accessibility.
Quality Focus: Refine data with deduplication and completeness checks to enable operational insights.
Platinum Layer (Advanced Analytics and AI)
Purpose: Enable advanced analytics, predictive modelling, and machine learning applications.
Processes: Utilise enriched data from Gold to train models and provide predictive insights.
Quality Focus: Maintain high standards for timeliness and accuracy to support strategic foresight.
Data Operating Capabilities:
A Data Warehouse & Data Mart Operating Model alone does not create quality and value but requires an intersection of process, people, and technology conceived around the data model to provide its actual value. Building processes and organisational structures to deliver compelling data products to users is the realisation of what the Data Operations Model aims to provide.
Process
- Data Engineering will…
| Action | Objective | Quality Measures |
| Data Flow Implementation | Implement data flows to seamlessly connect operational systems with analytics and business intelligence (BI) systems. | Ensure data integrity throughout the flow. Validate data consistency and accuracy at each stage. |
| Source-to-Target Mapping Documentation | Document clear source-to-target mappings for transparency and traceability. | Ensure mappings are comprehensive and up-to-date. Verify mappings against actual data transformation processes. |
| Data Flow Re-engineering | Re-engineer manual data flows for scalability and repeatability. | Assess scalability potential. Test repeatability under various scenarios. |
| ETL Script Optimisation | Write efficient ETL (Extract, Transform, Load) scripts and code for optimal performance. | Conduct performance testing on ETL processes. Optimise scripts for resource efficiency. |
| Reusable Business Intelligence Reports | Develop business intelligence reports that are reusable and adaptable. | Test report generation under different conditions. Ensure reports meet stakeholder requirements effectively. |
| Accessible Data for Analysis | Build accessible datasets to facilitate easy analysis. | Validate data accessibility across relevant platforms. Ensure data security and compliance with access controls. |
| AI Analytics Readiness | Prepare data infrastructure and pipelines to support AI-driven analytics and machine learning models. | Assess compatibility with AI frameworks and libraries. Ensure data quality and format suitability for AI model training and inference. |
People
Data literate colleagues is key for delivering value to the business. Building data literacy requires common definitions and understanding of competencies needed for us to work together in treating data as an enterprise asset. A Competency Framework provides a model to guide literacy efforts, which involves all colleagues working with data (Knowledge Workers and Data Consumers). The following skills form the basis of the data competency framework, the level and degree colleagues should show these skills is dependent upon their role and the corresponding skill level requirements (i.e. awareness, working, practitioner, expert)
Technology Tracks:
BMT uses advanced technologies to streamline data management, from ingestion to analytics. Key tools include:
- Microsoft Fabric: Azure-based platform for scalable, secure data storage and management.
- Common Data Model: Dimensional modelling that structures data for efficient analysis and reporting.
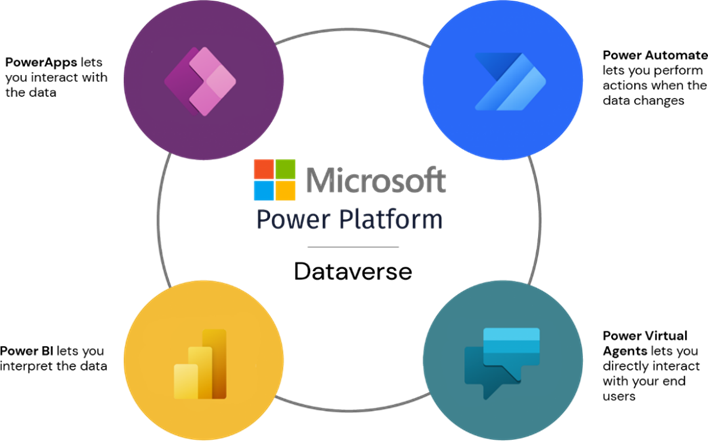
- Power Platform: Suite of BI tools, dashboards, and models for data access and visualization.
Each technology platform is configured for optimal performance and accessibility, enabling seamless integration with Power BI and other data tools.
Microsoft Fabric
BMT has chosen Microsoft Fabric as the foundation for its data warehouse and data mart environments. This integrated set of data and analytical services, based on the Azure/Synapse Cloud, provides a robust platform for managing BMT’s data assets efficiently.
Key components of Microsoft Fabric include:
- Azure Cloud–Based Containers: BMT utilises Azure cloud-based containers to create and manage its data, providing scalability and flexibility in storage and computing resources.
- Data Pipelines: Designing pipelines to copy data into the Lakehouse, a central repository for structured and unstructured data, ensures seamless data ingestion and availability for analysis.
- Job Management: Scheduled and triggered job definitions enable BMT to submit batch or streaming jobs for data processing, ensuring timely updates and insights.
- Notebooks: Leveraging notebooks allows BMT to write code for data ingestion, preparation, and transformation, facilitating flexible and customisable data workflows.
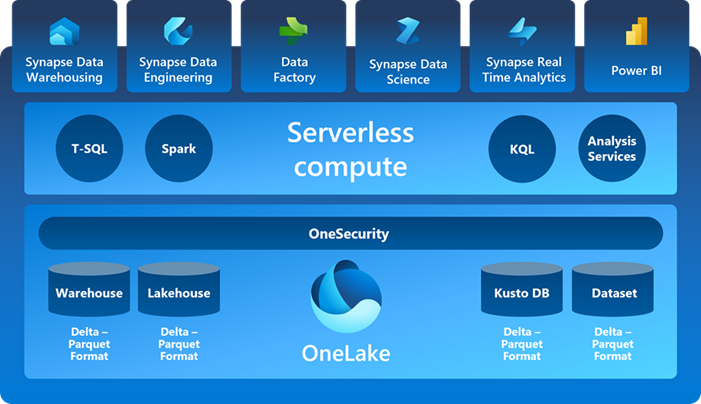
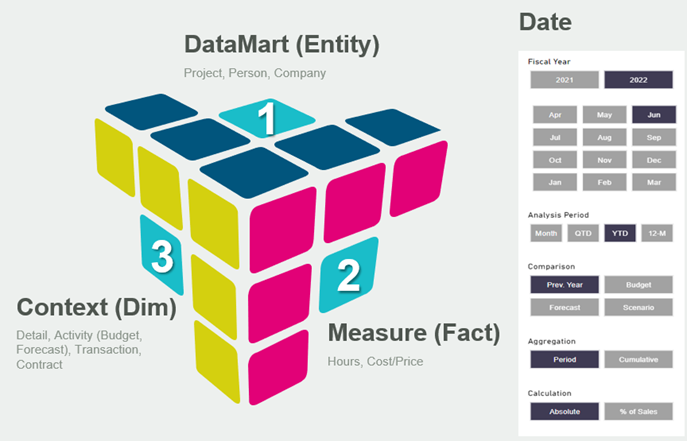
Common Data Model
At the core of BMT’s data warehouse architecture is the Common Data Model, which serves as the foundation for representing the organisation’s core business processes and common form designs. The Common Data Model supports dimensional modelling, where data is structured into measurement facts and descriptive dimensions, enabling efficient querying and analysis.
Dimensional models, instantiated as star schemas or cubes in relational databases, provide a structured framework for organising and accessing data, facilitating reporting and analytics processes.
Power Platform
BMT leverages the Power Platform to construct a broad range of business intelligence (BI) applications, empowering users to access, analyse, and visualise data effectively. This includes:
- Standardised Reports: Creating standardised reports to provide consistent and actionable insights across the organisation.
- Parameterised Queries: Constructing parameterised queries to enable users to customise data retrieval based on specific criteria or filters.
- Dashboards and Scorecards: Developing dashboards and scorecards to monitor key performance indicators (KPIs) and track organisational goals and objectives.
- Analytic Models and Data Mining: Building analytic models and data mining applications to uncover hidden patterns and trends in the data, facilitating data-driven decision-making.
Integrating the data warehouse or data marts with Power BI involves several key steps:
- Establishing Connections: Configuring data connectors to extract data from the data warehouse or data marts into Power BI, ensuring seamless data integration and accessibility.
- Optimising Data Models: Optimising data models for performance by reducing unnecessary data, optimising relationships, and defining appropriate data types and formatting, enhancing the efficiency of Power BI reports and dashboards.
- Utilising API Connectors: Configuring API connectors in Power BI to authenticate and securely connect to external APIs, enabling data retrieval and integration from diverse data sources.
By following these principles and leveraging Microsoft Fabric, the Common Data Model, and the Power Platform, BMT ensures a robust and integrated approach to data management, analytics, and reporting, driving informed decision-making and business success.
Governance Framework
The DOM’s governance framework defines clear roles, policies, and responsibilities, ensuring data is trustworthy, compliant, and effectively managed across its lifecycle.
Data Governance Structure: Establishes an oversight committee and data stewards across departments to maintain quality.
Roles & Responsibilities: Assign data owners, stewards, and custodians to manage, validate, and secure data across departments.
Quality Control and Continuous Improvement: Routine audits and feedback loops ensure that quality standards are maintained and improved.
Information Management Workstream:
Responsible for setting strategic objectives, policies, and priorities related to data governance and quality management.
| Name | Role (in this context) | RACI |
| Julie Stone | Chair of Information Workstream | Accountable |
| Sarah Martino | BIRA Manager | Responsible (Reporting) |
| Julian Kellett | Senior Data Engineer | Responsible (Data Engineering) |
| Simon Willmore | Head of Digital Strategy | Consulted |
| Mathew Rowley | Head of Accounting UK | Consulted |
| Sarah Long | Data Manager | Consulted |
Data Stewards:
Business stakeholders responsible for defining data requirements, priorities, and usage guidelines.
| DataMart | Named Responsibility | Role |
| Finance | Sarah Martino | Finance Manager |
| Employee | Gudrun Neumann | Head of People |
| Resource | Simon Mathieson | Technical Assurance and Capability Director |
| Project | Mike Prince | Global PMO Director |
| Customer | David Dring | Head of Future Business Operations |
| Business Opportunities | ||
| Contract | ||
| Supplier | ||
| Infrastructure |
Data Specialists:
Appointed individuals responsible for managing specific data domains, overseeing data quality, and ensuring compliance with governance policies.
| Name | Finance | Employee | Resource | Project | Customer | BusOpp | Contract | Supplier | Infrastructure |
| Martyn Cole | I | R | R | C | I | ||||
| Sam Jepson-Whyte | R | C | |||||||
| Soon Tan | C | C | R | ||||||
| Emma O’Neill | R |
Data Custodians:
IT personnel responsible for implementing and maintaining data management infrastructure, including data pipelines, data lakes, and ETL processes.
| Name | Role (in this context) | Domain |
| Julian Kellett | Data Architect | Data Warehouse & DataMart |
| Ali Ahmed | Data Engineer | Data Lake |
| Chris Clark | Application of SharePoint | Enterprise Applications |
| Lee Southam | IT & Data Asset Security | IT Infrastructure |
| Steve Smith | Development Engineer | Power Apps |
| Will Newham | Operational Data Management | IFS (UK) Data |
| Chris Thomas | Operational Data Management | HubSpot Data |
Continuous Improvement:
Commitment to ongoing review and improvement of the data quality plan and associated processes.
Description of how feedback, lessons learned, and best practices will be incorporated to enhance data quality management efforts.
There is an underlying commitment by all stakeholders to ongoing review and improvement of the data quality plan and associated processes. This requires feedback, lessons learned, and best practices to be incorporated to enhance data quality management efforts.
Feedback Mechanisms:
Feedback from data consumers and stakeholders will be solicited to identify areas for improvement in data governance and quality management.
Review and Optimisation:
Regular reviews and audits of data governance processes and outcomes will be conducted to identify opportunities for optimisation and enhancement.
Training and Education:
Training programs will be provided to educate employees on data governance best practices, data quality management techniques, and compliance requirements.
Knowledge Base:
A self-service repository/library will be provided to store easily retrievable information about DataMart as well as how-to guides, learning and other knowledge articles.
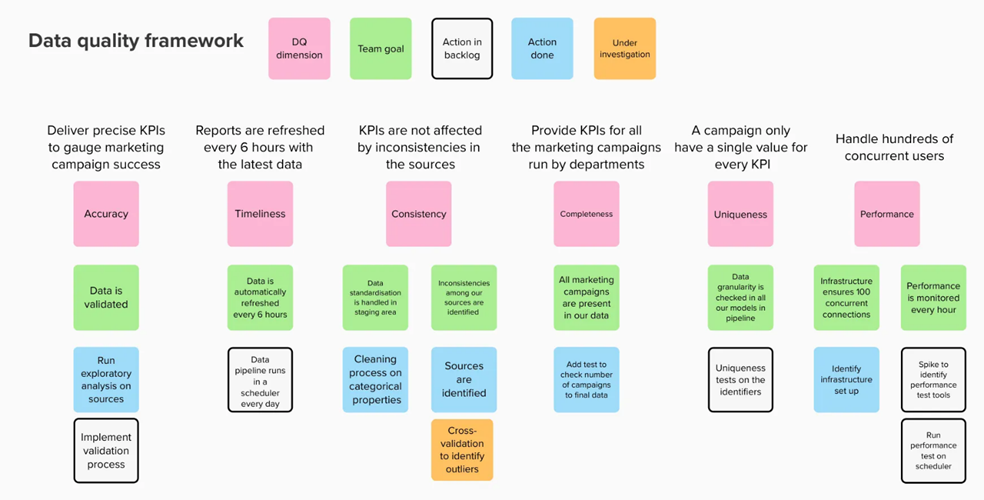
Data Quality Dimensions and Standards
Data quality management within the DOM ensures that data remains accurate, consistent, timely, and reliable across the organisation.
- Accuracy: Verification protocols to ensure data accurately reflects real-world conditions.
- Completeness: Data completeness checks ensure no gaps or missing values, maintaining dataset integrity.
- Consistency: Standardisation ensures data across sources and departments is aligned for comparison.
- Timeliness: Data is accessible as needed, with updates aligned to BMT’s decision cycles.
- Uniqueness: De-duplication efforts at all layers to avoid redundancy and ensure efficient data use.
- Usability: Ensures data is structured, accessible, and understandable for end-users across BMT.
Accuracy
How well does a piece of information reflect reality?
Accuracy refers to the degree in which the data correctly portrays the real-world situation in which it was originally designed to measure. Data must be meaningful and useful to allow for correct and accurate interpretation and analysis. For data to be accurate, it must also be valid, meaning it must conform to a defined format whilst implementing and adhering to specific business rules, which may be recorded in a metadata repository (a system or application where information about the data (metadata) is stored and managed).
Completeness
Does it fulfil our expectations of what’s comprehensive?
This dimension reflects the ability to determine what data is missing, and whether omissions are acceptable (for example, optional data). Departments must determine and understand whether a data asset contains unacceptable gaps, as these may place limitations on the data leading to an increased reliance on assumptions and estimations or preclude the asset for use altogether. It is also useful to note the level of completeness, particularly if achieving 100% completeness may not be necessary to fulfil the dataset’s intended purpose. Also, if the dataset is considered complete as at a particular point in time, e.g. beginning or end of month.
Consistency
Does information stored in one place match relevant data stored elsewhere?
Consistency of data means that the data is collected, grouped, structured, and stored in a consistent and standardised way. This requires standard concepts, definitions, and classifications to be implemented across departments, and agreed upon as to their meanings and interpretation.
Data must also be consistent in the context of its use. For example, data may appear similar but have different meanings or uses in different departments. Duplication, or different meanings for similar data, may result in confusion or misinterpretation of data and render such data unsuitable for comparison with related assets. Also, it may be unclear if trends are due to a true effect or due to problems with inconsistent data collection.
Timeliness
Is our information available when you need it
Timeliness refers to how quickly data can be made available when required, and the delay between the reference period (period to which data refers, such as a financial year) and the release of information. Factors that may impact this include collection method and processing. Data must be discoverable, available, and accessible throughout all stages of the data asset lifecycle from creation to retirement, to be available for greater internal use, external use (external partners, other government departs and researchers) and the public. If delays occur during the provision of data, currency and reliability may be impacted.
Uniqueness (integrity)
Can different data sets be joined correctly to reflect a larger picture?
There must be the capacity to make meaningful comparisons across multiple data assets. This is achieved through common data definitions and standards. Common data definitions should be agreed and shared across the department, and any inconsistencies should be managed.
Usability
Is our data structured and accessible for effective use?
Usability ensures that data is organised, accessible, and understandable for end-users, enabling them to efficiently obtain meaningful insights without unnecessary complexity. High usability means data is not only available but also intuitive and actionable, supporting quick decision-making and operational activities. This requires data to be accessible via clear interfaces and structured in formats that align with users’ knowledge and needs, helping them navigate data with minimal support.
Data usability also involves establishing appropriate metadata, user documentation, and visualisation aids to support seamless access and interpretation. By prioritising usability, BMT ensures that data is readily adoptable across departments and contributes effectively to business objectives.
Data Operating Model with SOP Integration
Standard Operating Procedures (SOPs) guide the DOM’s processes, ensuring efficiency and consistency at each stage.
Purpose & Scope of the Data Operating Model
- Purpose: The Data Operating Model aims to create a unified, secure, and optimised data framework supporting BMT’s strategic goals. The SOPs integrated into each stage will ensure adherence to data quality, accessibility, and governance standards across the data lifecycle.
- Scope: This model covers end-to-end data processes, from acquisition to archiving, with SOPs providing the “how-to” framework for each function.
Standard Operating Procedures Across Key Stages
Data Planning SOPs
- Define Data Quality Goals: Set specific, measurable quality objectives aligned with BMT’s business needs.
- Assess Current State: Perform data profiling and gap analysis to establish a baseline for improvement.
- Data Quality Metrics: Set SMART KPIs to assess data accuracy, completeness, and timeliness.
- Stakeholders and Responsibilities: Define roles like data stewards, owners, and custodians for accountability.
- Data Quality Policies & Standards: Establish consistent standards for data handling, aligned with governance policies.
Data Acquisition SOPs
- Identify & Assess Data Sources: Ensure each source meets BMT’s data standards.
- Define Data Acquisition Requirements: Specify data types, update frequency, formats, and quality benchmarks.
- Quality Checks and Automation: Implement automated checks and ETL processes to maintain data integrity and efficiency.
- Data Governance Policies: Uphold data governance standards across acquisition and ingestion, including permissions and compliance.
Data Processing & Maintenance SOPs
- Data Profiling & Analysis: Monitor data quality metrics continuously to spot issues early.
- Data Quality Improvement Initiatives: Clean, enrich, and validate data as it progresses through transformation stages.
- Data Quality Governance: Appoint responsible parties for ongoing quality assurance and establish quality checks across transformations.
- Training and Education: Regularly train team members on quality standards and practices, including new tools and technologies.
Data Publish & Share SOPs
- Data Documentation & Publishing: Maintain metadata, data dictionaries, and lineage info for clarity and user understanding.
- Access Controls & Distribution: Use role-based access to publish data to authorised users and platforms securely.
- Data Quality Monitoring Post-Publishing: Ensure published data remains relevant and accurate with periodic checks.
- Feedback & Usage Tracking: Collect stakeholder feedback to improve future data outputs and track how data is used.
Snapshot & Archive SOPs
- Define Snapshot Requirements & Schedule: Specify retention and archiving policies.
- Snapshot Creation and Archiving: Establish regular intervals to create and archive data snapshots for historical integrity.
- Data Access Controls and Recovery: Ensure archived snapshots remain secure yet accessible for necessary use.
- Audit and Compliance Reviews: Regularly audit archived data to ensure compliance and integrity over time.
Data Flow and Governance within the DOM
- Data Governance SOPs: SOPs standardise processes around data governance, ensuring quality, accountability, and secure access at each lifecycle stage. For instance, SOPs outline specific steps to ensure data consistency, accuracy, and quality control across layers.
- Quality Assurance: SOPs bring a layer of predictability and assurance, so that every stage from acquisition through archiving operates with the same level of rigour, establishing BMT as a data steward.
- Data Integration and Interoperability: SOPs for integration allow streamlined data exchange and reduce redundancy, ensuring data moves seamlessly across departments and can be used universally.
Integration with Business Process Strategy
- SOPs contribute to embedding data into business workflows, providing predictable processes for gathering, processing, and disseminating data across departments, improving customer insights, operational efficiency, and compliance.
Adaptability & Scalability through SOPs
- SOPs ensure that as BMT scales or adopts new data sources, each addition follows a consistent and robust process, reducing risk and enhancing agility.
Performance and Accountability
- With SOPs, each role has clear responsibilities for executing and monitoring data processes, enabling accountability.
- SOPs support continuous improvement by regularly reviewing practices to meet changing needs and industry standards, tracking data quality KPIs, and ensuring every stage aligns with BMT’s strategic goals.
Data Quality Improvement Initiatives
It is essential for BMT to take a holistic approach and adopt a combination of different strategies, such as Data Ops, Data Observability, Data Mesh, and Data Quality Checks to improve the quality of data. Despite the differences in focus, one common thing among the frameworks strategies above is the need for a unified governance structure. This structure ensures data is used and managed consistently and competently across all teams and departments.
The DOM includes a series of initiatives aimed at continually elevating data quality standards across BMT’s data environment.
- DataOps & Continuous Integration: Automated testing and version control support consistent, reliable data processing.
- Data Observability and Monitoring: Real-time monitoring for anomalies in data ingestion, consistency, and accuracy.
- Data Mesh Principles for Decentralised Ownership: Empowers domain-specific teams to manage data while adhering to centralised governance standards.
- Feedback Loops: Mechanisms for data users to provide input, promoting continuous refinement of data standards and procedures.
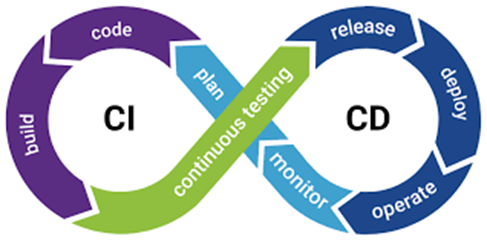
Data Ops (CI/CD)
Continuous Integration and Continuous Deployment ensure that changes and updates to data pipelines are automatically tested, integrated, and deployed to production, facilitating consistent and reliable data processing and delivery.
In dynamic data environments where data sources, formats, and requirements evolve rapidly, CI/CD provides a framework for automating the testing, integration, and deployment of data pipelines. This ensures that changes and updates to data pipelines are rigorously tested and validated before being seamlessly deployed to production environments.
In Data Engineering, this involves automating testing new ETL code, validating data schema, monitoring data quality, detecting anomalies, deploying updated data models to production, and ensuring that databases or data warehouses have been correctly configured.
| CI/CD Development Lifecycle |
- CI/CD Quality Actions in Data Pipelines
| Principle | Activity | |
| CI | Automated Testing | Automated tests check the integrity and quality of data transformations, ensuring that data is processed as expected and any error is spotted early. |
| Version Control | Data pipeline code (e.g., SQL scripts, Python transformations) is stored in repositories like Git, allowing tracking and managing changes. | |
| Consistent Environment | CI tools can run tests in environments that mirror production, ensuring that differences in configuration or dependencies don’t introduce errors. | |
| Data Quality Checks | These might include checks for null values, data range violations, data type mismatches, or other custom quality rules. | |
| CD | Automated Deployment | Once code changes pass all CI checks, CD tools can automate their deployment to production, ensuring seamless data flow. |
| Monitoring and Alerts | Once deployed, monitoring tools keep track of the data pipeline’s performance, data quality, and any potential issues. Automated alerts can notify on discrepancies. | |
| Development Branch Management | In case an issue is identified post-deployment, CD processes allow for quick rollbacks to a previously stable state of the data pipeline. |
Data Observability
The overarching goal of Data Observability is proactive problem-solving, where any anomalies or discrepancies are swiftly identified and rectified before they escalate into issues. Through continuous monitoring and analysis, data observability helps to maintain the reliability, accuracy, and accessibility of their data assets, thereby fostering trust and confidence in data-driven decision-making.
- Principles of Data Observability
| Principle | Activity | So that … |
| Freshness | Ensure that data is up-to-date and reflects the most recent state of the source systems | users can make decisions based on timely and accurate information, leading to more informed and effective actions. |
| Distribution | Monitor how data is spread across systems and locations to ensure that it falls within acceptable ranges and thresholds | potential issues such as data skew or imbalance can be identified and addressed promptly, maintaining data quality and integrity across the distributed environment. |
| Volume | Track the volume of data being ingested, processed, and stored | capacity planning and resource allocation can be optimised, preventing infrastructure overload or resource contention and maintaining efficient data processing. |
| Schema | Validate data schema consistency and evolution over time | data compatibility and interoperability are maintained, preventing errors and inconsistencies that could disrupt downstream processes or analyses. |
| Lineage | Capture and visualise the lineage of data, including its origins, transformations, and destinations | data provenance and impact analysis can be performed, enabling users to trace data back to its source and understand its journey through the data pipeline. |
Data Mesh
The Data Mesh decentralises data ownership by transferring the responsibility from the central data team to the business units that create and consume data.
By decentralising data ownership to domain teams, Data Mesh promotes agility, innovation, and accountability within BMT. It enables faster decision-making, facilitates collaboration across business units, and empowers domain experts to derive actionable insights from data more effectively.
It operates on the principles of domain-driven design, product thinking, and federated governance.
- Data Mesh Principles
| Principle | Activity | So that… |
| Domain-oriented Decentralised Data Ownership and Architecture: | Implement data flows to seamlessly connect operational systems with analytics and business intelligence (BI) systems | domain teams can own and manage their data independently, fostering agility and innovation within their domains. |
| Data as Product: | Document clear source-to-target mappings for transparency and traceability | data is treated as a valuable product, ensuring that it is well-understood, curated, and accessible for consumption by domain teams. |
| Self-service Infrastructure as a Platform: | Provide a data developer portal (myBMT & Knowhow) | domain teams can autonomously access and utilise data infrastructure and tools, enabling them to build, deploy, and manage data pipelines and applications without the need for extensive support from centralised teams. |
| Federated Computational Governance: | Provide support for the development and maintenance of data analysis/analytics systems | Best practice and computational learning can be distributed, allowing domain teams to govern their data processing and analytics workflows according to their specific needs and requirements. |
Data Rules & Quality Checks
Data Quality Rules/Checks, allows the Data Specialist to directly address and uphold the quality dimensions of accuracy, completeness, and consistency, ensuring that the data meets the desired standards and remains reliable for analysis and decision-making.
- Data Quality Rules
| Principle | Activity | So that … |
| Accuracy | Ensure that data is accurate and free from errors or inaccuracies | stakeholders can make reliable decisions based on trustworthy information, leading to improved business outcomes and performance. |
| Completeness | Verify that all required data elements are present and accounted for | analyses and reports are comprehensive and representative of the entire dataset, reducing the risk of biased or incomplete insights. |
| Consistency | Enforce consistency in data values and formats across systems and sources | data can be seamlessly integrated and aggregated, avoiding discrepancies and ensuring compatibility for downstream processes and analyses. |
| Missing Data | Identify and flag instances where data is missing or incomplete | gaps in the dataset can be addressed promptly, preventing erroneous conclusions or decisions based on incomplete information. |
| Duplicate Data | Detect and eliminate duplicate entries or records within the dataset | data integrity is maintained, preventing overcounting or inaccuracies in analyses and ensuring a single source of truth for reporting and decision-making. |
| Format Validation | Validate data formats to ensure consistency and adherence to predefined standards | data can be accurately interpreted and processed by downstream systems or applications, minimising errors and compatibility issues. |
- Management of Error Precursors
| Risk/Issue | Mitigation |
| Dependency Failures: Failures in upstream systems or dependencies affecting data availability.Unreliable third-party data sources or services.Failure to handle dependency failures gracefully within the pipeline. | Dependency Isolation: Isolate dependencies within the data pipeline to minimise the impact of failures on other components. Use service boundaries, microservices architecture, and message queues to decouple dependencies and prevent cascading failures from propagating throughout the pipeline. |
| Data Pipeline Configuration Errors: Incorrect configuration settings for data pipeline componentsMisconfigured data connections or permissionsChanges to pipeline configurations without proper testing or validation | Configuration Management System: Implement a robust configuration management system to centralise and manage configuration settings for data pipeline components. Utilise version control systems, such as Git or Subversion, to track changes to configuration files and ensure consistency across environments. |
| Data Quality Issues: Missing valuesIncorrect data formatsInconsistent data across sources | Data Quality Monitoring: Implement data quality monitoring processes to continuously monitor the quality of incoming data. Set up alerts or notifications to flag instances of missing values, incorrect formats, or inconsistencies in real-time, allowing for prompt remediation. |
| Resource Exhaustion: Exhaustion of system resources (e.g., memory, CPU, storage) leading to pipeline failuresInefficient resource utilisation or allocation within the pipeline infrastructureFailure to scale resources dynamically based on workload demands | Modularisation: Break down the pipeline into modular components to improve scalability, maintainability, and flexibility. Design modular components that perform specific tasks or functions, such as data ingestion, transformation, and loading, and orchestrate these components in a cohesive and efficient manner. |
| Monitoring and Alerting Failures: Ineffective monitoring of pipeline health and performanceFailure to detect and alert on anomalies or errors in a timely mannerLack of visibility into pipeline status and health metrics | Proactive Health Checks: Conduct proactive health checks of the data pipeline at regular intervals to identify potential issues before they escalate. Use automated scripts or monitoring tools to perform health checks on data sources, processing components, and downstream systems. |
| Data Security Breaches: Unauthorised access to sensitive data within the pipelineData leaks or breaches due to inadequate security measuresInsider threats or malicious activities compromising data integrity | Role-Based Access Control (RBAC): Implement role-based access control (RBAC) mechanisms to manage data pipeline permissions and access rights. Define roles and permissions for different user groups or personas, and assign permissions based on job responsibilities and data access requirements to prevent unauthorised access or misuse of data. |
| Data Integration Problems: Incompatibility between different data formats or schemasIssues with data synchronisation between systems or databasesData loss or corruption during integration processes | Schema Standardisation: Establish standardised data schemas or formats to ensure compatibility between different systems or databases. Define and enforce data standards to facilitate seamless integration and minimise conflicts or inconsistencies in data structures. |
| Data Transformation Errors: Logic errors in data transformation processesInaccurate data aggregations or calculationsMismatched data types during transformation | Continuous Improvement Practices: Foster a culture of continuous improvement by regularly reviewing and optimising data transformation processes. Encourage feedback from stakeholders and team members to identify areas for enhancement and implement iterative improvements to increase the efficiency and reliability of data transformations. |
| Network Connectivity Issues: Network outages or latency affecting data transmission between componentsPacket loss or network congestion impacting data transfer reliabilityInadequate network bandwidth for data pipeline requirements | API Integration: Utilising APIs (Application Programming Interfaces) for data transmission between components can provide a standardised and reliable communication mechanism. APIs offer well-defined interfaces for data exchange, allowing you to establish robust connections and implement error handling mechanisms to handle network outages or latency effectively. |
| Data Processing Bottlenecks: Slow or inefficient processing of large volumes of dataResource constraints leading to processing delaysInadequate scalability of processing infrastructure | Reorganise Pipeline: By reorganising the pipeline for efficiency, you can optimise resource utilisation, reduce processing latency, and improve overall system performance, enabling faster and more scalable data processing workflows. |
Data Acquisition and Transport Workflow
Objective: Efficiently acquire data from various sources and ensure secure, accurate, and timely transport to the data lakehouse and data warehouse.
Steps:
Data Source Identification and Mapping
- Action: Identify relevant data sources, including databases, applications, and third-party sources.
- Deliverable: Data source inventory, data mapping documents.
- Control Measures: All data sources SHALL be described in myBMT, EA solution SHALL map enterprise interactions.
Data Profiling and Classification
- Action: Profile data sources to understand data quality and classify based on sensitivity.
- Deliverable: Data profiling reports, classification tags.
- Control Measures: Sensitivity levels defined by DataMart Owner, data tagged for classification, metadata management in myBMT.
Data Acquisition and Integration
- Action: Use ETL processes to acquire data and transport it to the data lakehouse.
- Deliverable: ETL process documentation, transfer logs.
- Control Measures: Data encryption for sensitive data, archiving of source data before processing, transfer logs applied at each pipeline stage.
Transport to Data Warehouse
- Action: Orchestrate the secure and accurate transfer of data from the lakehouse to the data warehouse.
- Deliverable: Data warehouse integration reports.
- Control Measures: Continuous monitoring, execution logs identifying external agents and calling users.
Testing and Validation
- Action: Perform integration testing to ensure the ETL process works end-to-end from source to warehouse.
- Deliverable: Test reports, validation results.
- Control Measures: Data views in DataMarts checked for errors, data accuracy validated.
Datamart/Reporting Development Workflow
Objective: Design, develop, deploy, and maintain Datamarts with a focus on performance, security, and usability.
Steps:
Data Discovery and Requirements Gathering
- Action: Identify business requirements, profile data, and align with stakeholders.
- Deliverable: Business requirements document, stakeholder alignment summary.
- Control Measures: Data discovery supported by myBMT, ensuring all in-scope data is discoverable.
Datamart Design and Security Planning
- Action: Design the data models, schema, and architecture for the Datamart. Plan for security and access control.
- Deliverable: Data models (conceptual, logical, physical), security specifications.
- Control Measures: Sensitivity levels defined, data tagged for owner and metadata classification, schemas with restricted access policy applied.
MVP Development and Iteration
- Action: Develop a minimum viable product of the Datamart, iterating based on feedback.
- Deliverable: MVP with essential features, test reports.
- Control Measures: Prototypes developed, feedback logged, and iterated on MVP features.
Deployment and Go-Live
- Action: Deploy the Datamart into the production environment, ensuring system readiness and user training.
- Deliverable: Deployed Datamart system, user training materials.
- Control Measures: Environments set up, data integrated, security measures validated, users trained.
Maintenance and Performance Testing
- Action: Regular maintenance, performance testing, and documentation updates for Datamarts.
- Deliverable: Performance test reports, updated documentation.
- Control Measures: Snapshots of DataMart views taken weekly, performance testing conducted, and documentation stored in myBMT.