1.3
Executive Summary
BMT’s reporting strategy aims to maximize data use through data governance, Microsoft-based and native IFS technologies, and a common data model for accuracy and consistency. This will enable advanced analytics to enhance decision-making.
The strategy also includes the implementation of a federated data governance model, where regional businesses will follow a centralised set of Data Governance for core and common systems. The reporting strategy also includes how users are delivered Power BI reports by the Business Reporting Hub on NAVIGATOR. The strategy outlines how we will make the best use of in-system lobbies and reports combined with Power BI and Data Warehouse backed reports where sources of data need to be consolidated. Users will be granted Role Based Access to these reports and where needed will access data appropriate to their region and role.
Overall, the reporting strategy provides a comprehensive and well-thought-out approach to managing and utilising BMT’s data to drive business growth and success. The significance of business intelligence for the organisation is that it can effectively leverage its data to drive innovation, create efficiencies, and add value to its existing propositions.
Table of Contents
Introduction
1.1 Why We Need a Data and Reporting Strategy
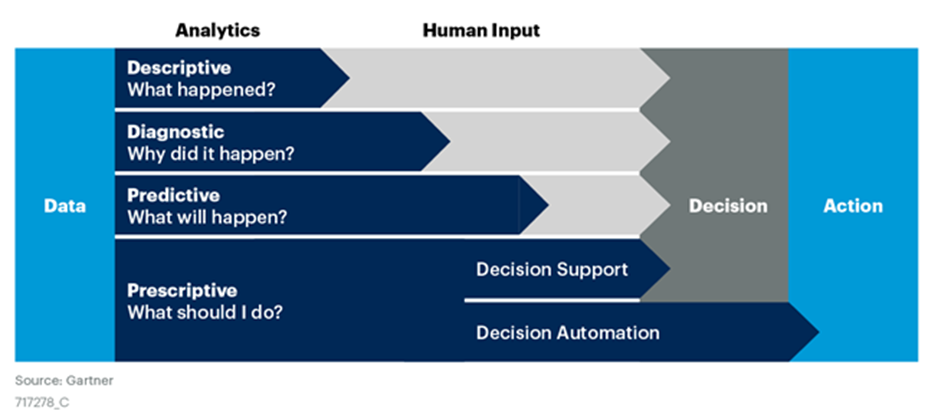
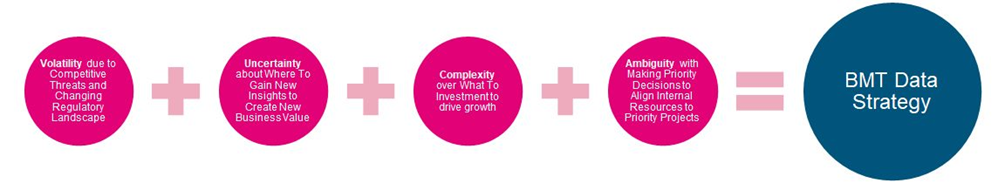
In BMT we see a rapidly changing landscape of risks, opportunities and constraints around data. Whether this is the data we use to make decisions every day to how we support our customers or our employees. Our Business Strategy and our Business Risks build a picture that shows how volatile, uncertain, complex and ambiguous this world is.
But also what is possible today is evolving quickly.
- As our systems become more integrated globally our ability to provide timely and descriptive analytics to users will increase hugely.
- By having more targeted reports we can provide more context to help individuals undertake their own diagnostic analytics to understand why things happened.
- With simple models applied to our global datasets we can deliver predictive analytics to help provide early insight into opportunities and risks.
- And combining these models and datasets with automation tools we can start to help individuals find out what they could do next with prescriptive analytics.
1.2 The Three Data Landscape Layers
To help us de-mystify the data analytics landscape, we will outline the three ‘layers’ of data:
‘transactional’ data (generated in the normal course of interactions with users),
‘operational’ data (needed to run and optimise the organisation) and
‘strategic’ data – (the insights and analysis needed to enable the business strategy to be informed, developed and implemented).
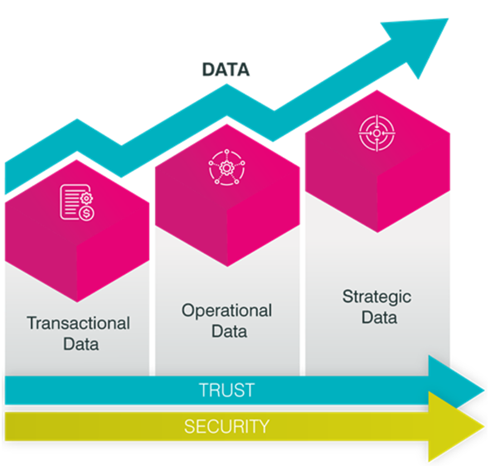
A fourth element should also consider the application of AI or machine learning to help understand one or more of the data landscape layers. A useful Insights paper on this model can be found here.
1.3 Our Data-Driven Vision for BMT
The volatility and uncertainty present both challenges and opportunities for our customers and ourselves, with data-driven insights offering substantial potential. We acknowledge the value that data brings to all parts of BMT, and our company-wide vision initially focuses on the customers-to-cash value chain and growing the business through strategic insights about our customers, markets, employees and business.
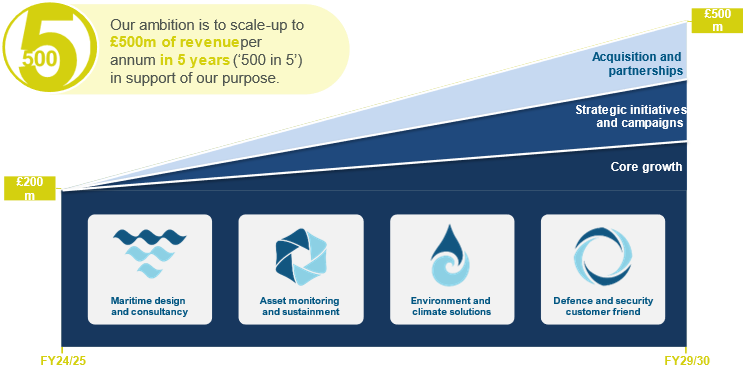
To achieve our goal of doubling revenue to become a £500M business in the next five years, we will:
- Assure our Transactional Data by building trust through appropriate Data Governance and developing the skills of our people.
- Deliver the Data & Analytics Capability (people and data warehouse) to support GMIS and other Business Systems.
- Develop our Operational Data by tracking and monitoring project data to improve delivery and profitability of our customer projects.
- Collect, analyse, and act on customer feedback to enhance the customer experience.
- Collect, analyse, and act on internal lessons learned from projects and audits to improve overall business delivery.
- Manage customer insights to target the right markets and opportunities.
By focusing on these areas, we anticipate significant growth in orders and profit margins, ultimately achieving our ambitious revenue target.
1.4 The Reporting Strategy
This Reporting Strategy outlines our approach to getting the most out of our data by setting out clear standards and a consistent approach for BMT.
We have a content management and deployment model which enables report writers and data owners to use a methodical and disciplined lifecycle management approach to reduce errors, minimise inconsistencies and improve the user experience for data consumers.
In our model we recognise that we have many data consumers but a relatively small team of report writers. The core team of report writers and technical support are centralised and shared across functions and the global business.
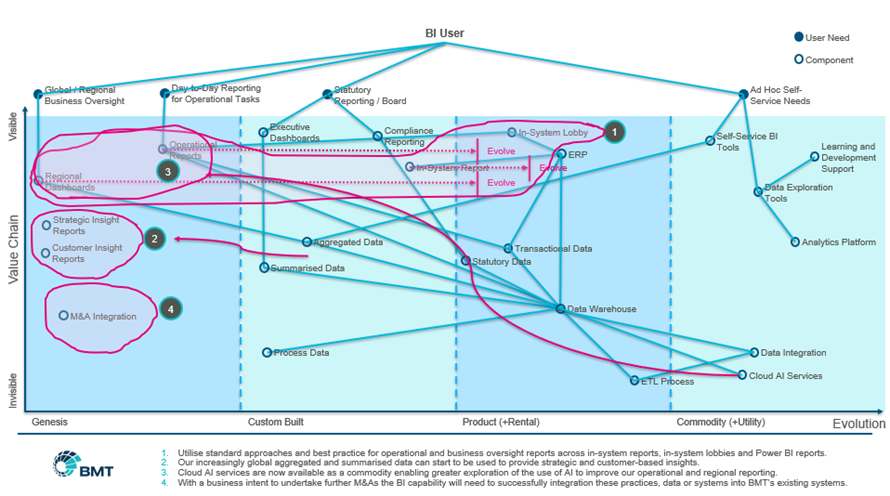
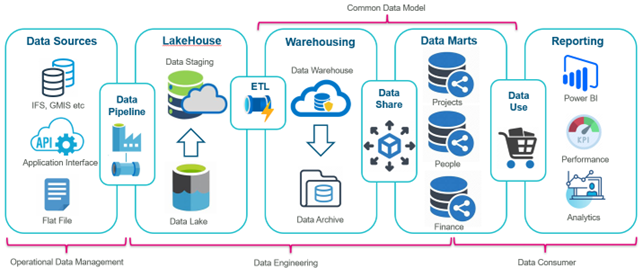
The following diagram Figure 1.4 depicts the high-level overview of the components used in our reporting strategy; this will be expanded upon in later sections. The primary focus is on providing an organisation-wide content distribution at scale alongside in-system reporting within certain applications such as IFS Cloud Lobbies.
Objectives
2.1 BMT’s Strategy and Vision
BMT aims to be a global leader in addressing the most significant engineering challenges of our time. Our vision is to excel in ship design and become a credible digital competitor by transforming asset life cycle and environmental services. We strive to be recognised for our collaborative approach, investing in our future and the futures of others through our work in communities, education, and the environment.
Our business ambition is straightforward: within five years, we aim to generate annual revenues of £500M across three global regions of roughly equal size. This growth will be achieved through both organic and inorganic means, ensuring that we meet our customers’ demands and exceed their expectations.
2.2 Changing Landscape
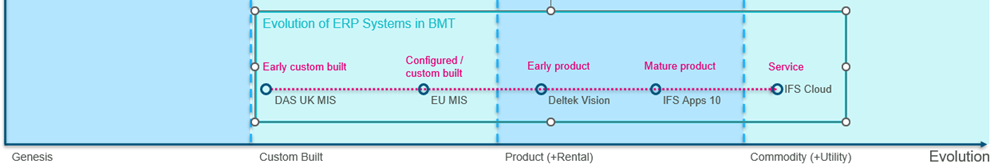
BMT’s internal landscape continues to simplify and cohere around a smaller set of Enterprise Applications. As we remove novel and custom-built applications, we continue to take advantage of product and commodity applications. The increased use of mature products and services is enabling BMT to cohere our Business Processes to increasingly ‘best practice’ approaches.
Data-driven insights of transactional, process, aggregated and summarised data is increasingly used within the business. The evolution of data warehousing, engineering, data science and AI/ML services to being on-demand cloud services has transformed how we provide data to the business. On demand or self-service business reports in applications like IFS Cloud or via Power BI Reporting service all require data integration. The commoditisation of cloud-based data services is enabling more widespread use of Business Reporting and will enable AI to support future predictions and analysis. Ensuring our approach to integration is cost effective whilst our demand for data-driven services is a priority. We must also consider how future changes in data usage such as providing more strategy insights or through M&As will be enabled by our integrations.
User expectations and simplicity of use has shifted and users now expect immediate access to data that is accurate and easy to use. With access to multiple sources and visualisation of the same data users expect clarity and consistency.
2.3 Reporting Goals
Considering the overall business objectives and goals we have identified the following the Reporting Goals:
- Ownership and Governance
- Data Ownership: Clarify who owns the data and reporting for different use cases particularly where the use of the data or ownership crosses several functions.
- Data Governance: Improve the quality and trust in our data and reports through the introduction of a Data Governance programme balancing risks and enabling the business to exploit the data.
- Simplification
- Rationalise Business Reporting: reduce the number of reports required to satisfy the key business needs.
- Appropriate Delivery Methods: reduce the duplication of reports between in-system
- Regional Reporting: Business Reports will be developed to support Global and Regional businesses avoiding the need to develop separate regional reports.
- Security and Access:
- Transparency: a catalogue of Business Reports will be available for all users to understand what is available, where and who has access to each report.
- Control of Sensitive Data: nationally protected, personal data and commercially sensitive information will be protected through our security and access controls of the data and to the final reports.
- Self-Service Employee Data: Make available to line managers and People Team professionals employee data ensuring that data protection and privacy is considered and rigorously maintained.
- Understanding our Skills: Making use of employee’s skills and aspirations to enable us to align our employees with the future demand whilst providing engaging careers.
2.4 Reporting Objectives and Solutions
To achieve the Reporting Goals, we have created a Data & Analytics capability and established enterprise-wide Data Governance. The introduction on single IFS Cloud instance to be the single source of truth for all global management information enables us to simplify and streamline our Business Intelligence.
The following Reporting Objectives are being progressed in FY25 and FY26.
- Launch of the Business Reporting Hub – completed in Dec 2024 the Business Reporting Hub provides a single touch point for employees and managers seeking access to global and regional business reports.
- Prepare for IFS Cloud – throughout FY25 we will create a data pipeline for the new IFS Cloud system as part of the broader G-MIS programme. This will include learning lessons from the IFS Apps 10 deployment in the UK whilst also supporting the G-MIS team with the introduction of IFS Reports and Lobbies to provide a holistic reporting framework.
- Successful Launch of IFS Cloud – starting in the FY26 the roll out of IFS Cloud to all regions we be supported with improved Business Reporting, IFS reports and IFS lobbies to support users fully realise the benefits of G-MIS.
- Extension of Enterprise Applications and Business Reporting – as new Enterprise Applications are launched; we will ensure that any relevant data is available to extend and scale the use of Business Reporting across BMT.
Business Requirements for Reporting
3.1 High Level Business Reporting Requirements
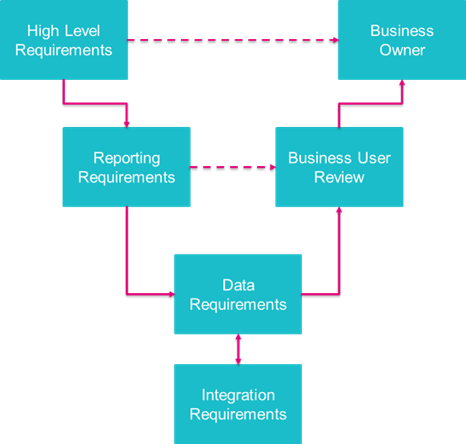
We recognise that specific report requirements are too detailed for a strategy document so instead we will introduce high level functional requirements and non-functional requirements derived from our data governance procedures. An outline framework showing specific requirements is contained at the Annex. The relationship between high level requirements, reports and data integrations along with sign off and approval is at Figure 3.1.
3.2 High Level Functional Requirements
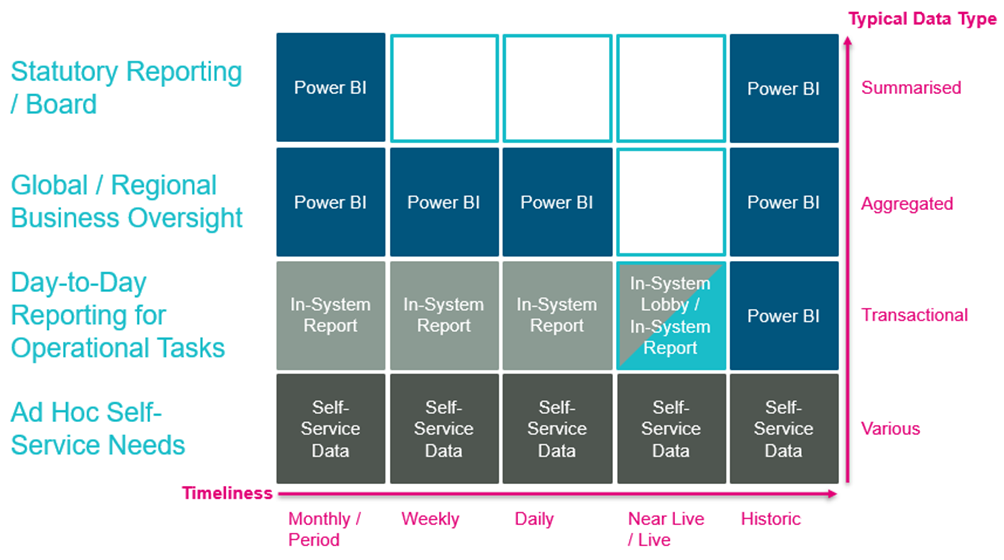
Our functional requirements are based around a simple framework. The Business Intelligence Framework recognises 3 dimensions of activity:
- Timeliness – the refresh rate required to make the report relevant to the user.
- Type of Data – to gain insight some users required data to be summarised, others need data aggregated from multiple sources and others need detail at a transactional level.
- Delivery Method – some delivery methods provide timeliness or types of data delivery not available in others, in some cases there are multiple options available. The four options available are to use a Power BI report, an in-system report, an in-system lobby or provide access to data for ad hoc analysis.
To simplify reporting at all levels the framework at Figure 3.3 is being used to align the expected delivery method. This framework will be explained in more detail in the following sections:
- 6Reporting Tools and Technologies – covers the tools and technologies used to support the delivery methods.
- 7Data Modelling and Transformation – covers the timeliness and type of data transformations covered in different use cases.
- 10Distribution and Delivery – the distribution method for Power BI reports specifically.
High level functional requirements have been developed utilising both a top down and bottom-up approach. Top down by articulating the business needs by Business Process areas and use cases (Board, Business Oversight etc.) and bottom up reviewing current reporting available globally, in UK and APAC. A comprehensive list of high-level report requirements are available at Annex A.
3.3 High Level Non-Functional Requirements
Our high-level user requirements are derived from our Data Governance Policies available on NAVIGATOR. These requirements are shown at Table 3.1.
| Title | Description | Justification | Section Covered In |
|---|---|---|---|
| Compliance and Governance | Ensure that reporting practices comply with industry regulations and internal governance. Implement data governance measures to maintain data quality and integrity. | Mitigates legal and compliance risks while ensuring the reliability and accuracy of reported information. | Data Governance |
| Reporting Tools and Technologies | Reports should be accessible and optimised for viewing on desktop mobile devices. Ensure a responsive design for a consistent user experience across devices. | Facilitates access to critical information on-the-go, catering to the needs of mobile users. | Reporting Tools and Technologies |
| Data Accuracy and Timeliness | Reports must present accurate and up-to-date information from reliable sources. Ensure that data refresh rates align with business needs for timeliness. | Ensures the reliability and relevance of information, supporting informed decision-making. | Data Modelling and Transformation |
| Performance and Scalability | Reports should load efficiently, even with large datasets. The system must scale to accommodate increased data volume over time. | Ensures a smooth user experience and supports future growth without compromising performance. | Data Modelling and Transformation |
| Cross-Functional Integration | The reporting system should seamlessly integrate data from various business functions. Ensure consistency and coherence in cross-functional reporting. | Supports a holistic view of organisational performance, fostering better collaboration and understanding. | Data Modelling and Transformation |
| Data Drill-Down and Exploration | Users should be able to drill down into detailed data for deeper insights. Provide interactive features for data exploration and analysis. | Facilitates in-depth analysis, empowering users to extract meaningful insights from the data. | Report Design Guidelines |
| Collaboration and Sharing | Enable users to collaborate by sharing reports and insights with colleagues. Provide options for exporting reports in different formats for sharing externally. | Promotes collaboration and knowledge-sharing, essential for effective team dynamics and external communication. | Security and Access Control |
| Security and Access Control | Implement role-based access control to restrict access to sensitive data. Ensure data security during transmission and storage. | Safeguards sensitive information, maintaining confidentiality and integrity of data. | Security and Access Control |
| User Accessibility | Users should have easy access to relevant reports based on their roles. The reporting system should support a user-friendly interface for navigation. | Enables quick and efficient access to pertinent information, improving user productivity and decision-making. | Security and Access Control |
| Development of Reports | Reports shall follow a lifecycle management approach to ensure that changes to reports do not impact live reports. | Improves business resilience and confidence within the reports. | Distribution and Delivery |
| User Searchability | Users should have a range of options to utilise reports from ad-hoc searches to inclusion in meetings. | Promote the move to a data-driven decision-making business whilst reducing the training burden. | Distribution and Delivery |
| Alerts and Notifications | Implement alerting mechanisms to notify users of significant changes or thresholds. Allow users to set up personalised notifications based on their preferences. | Enhances proactive decision-making by alerting users to important developments or anomalies. | Distribution and Delivery |
| Training and User Support | Develop training programmes to help users effectively utilise reporting tools. Establish a support system for addressing user queries and issues. | Ensures users are proficient in utilising reporting tools, and support is available when needed, reducing downtime. | Training and User Support |
Derived from BMT Data Governance Policies
Data Sources and Integration
4.1 Data Sources
There are numerous data sources in BMT many are integrated together in some way, and some are large scale Enterprise Applications and others are smaller. The Enterprise Applications within BMT is frequently under review as we rationalise and modernise our global systems.
4.2 Integrations Strategy
The Integration Strategy prioritises seamless connections between Enterprise Applications and the Global Data Warehouse to ensure standardised and accurate reporting.
Key Objectives:
- Centralised Integration: Systems such as GMIS and the Performance Portal (Cornerstone) connect directly to the Data Warehouse to align operational and reporting standards.
- Enhanced Accessibility: Build a consistent and reliable data flow to facilitate cross-functional analysis.
- Business Alignment: Ensure that integration supports overarching strategic goals and enhances decision-making capabilities.
- The strategy is designed to support both real-time and batch data processing requirements, with scalability to accommodate future applications.
Data Sources and Integration Principle 1 – Centralised Integrations
All core and common Enterprise Applications required are integrated into a Global Data Warehouse for Business Reporting. Regional reporting will be from the Global Data Warehouse to remove duplication and ensure consistency and cost-effective operation.
1.3 Integrations Architecture
The Integrations Architecture employs an API-First approach to achieve seamless, secure, and efficient data management.
Key Components:
- API-First Approach: APIs are the preferred method for real-time integration with cloud and SaaS systems.
- Secure Push Mechanisms: Regional and National systems, such as GMIS, may opt to, securely push data to the Global Data Warehouse.
- Cloud-Native Infrastructure: M365 and on-premises systems utilise cloud-native solutions, such as Power Query and Fabric, for scalability and reliability.
- Standardisation via Data Models: The Common Data Model (CDM) ensures all integrated systems follow a unified framework for data exchange.
Data Sources and Integration Principle 2 – API-First Integrations
Where available the information flows between Enterprise Applications will utilise API based flows rather than file transfer approaches.
1.4 Data Synchronisations
Data synchronisation ensures timely and consistent updates across systems:
- 24-Hour Cycles: Standard updates occur daily, ensuring accuracy without overloading systems.
- Flexible Schedules: Certain regions or critical systems may adopt more frequent synchronisations (e.g., hourly updates for incremental loads) and utilise a conditional load approach to not cause performance issues for any particular region.[SW1]
- Strategic Scheduling: Tailored schedules (daily, weekly, monthly) minimise user impact while meeting business needs.
- Incremental and Full Loads: Incremental updates are preferred where possible to optimise performance, while full loads may be scheduled for periodic data reconciliation.
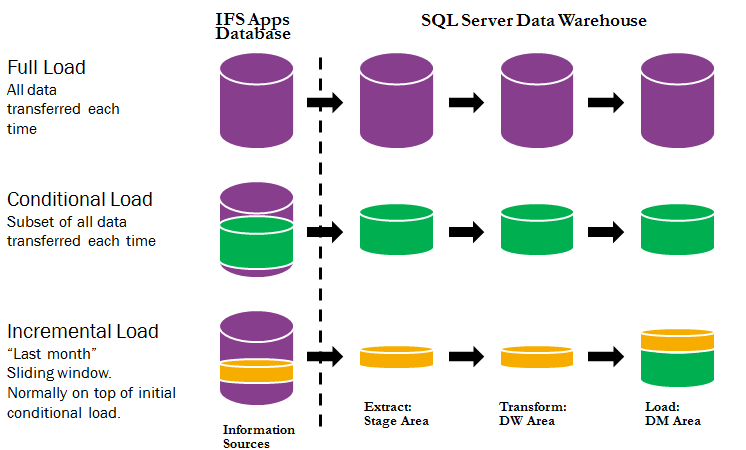
Data Sources and Integration Principle 3 – Synchronisation of Data
Data will be synchronised to meet the business requirement. Approaches will seek to optimise the cost of synchronising data utilising incremental, conditional and scheduled loads of data to avoid excessive processing of data where it is not required.
1.5 Interoperability
Interoperability is driven by the adoption of the Common Data Model (CDM), ensuring consistency across diverse systems and functions.
Key Benefits:
- Service-Oriented Architecture: CDM provides a framework to standardise data for Projects, Customers, Finance, and Employee systems.
- Automated Interoperability: The model enables automated data flows, reducing manual intervention and enhancing efficiency.
- Cross-System Consistency: Unified terminologies and formats simplify data sharing and integration across the organisation.
- The integration framework is designed to support both current and future applications, ensuring agility and scalability for evolving business requirements.
[SW1]Slight tweak here to look at conditional load as well as incremental load as a way of enabling “midnight” load for each region.
Data Governance
(Redrafted for Alignment with Data Operations Plan)
Key Takeaways
- Unified Approach: The governance framework aligns with a single ERP system, reducing regional differences while maintaining flexibility through a federated model.
- Currency Considerations: Includes provisions for consistent handling of multi-currency data and metadata tracking for accurate exchange rate management.
- Data Quality Assurance: Emphasises six dimensions of data quality, with automated monitoring and KPIs to ensure reliability and accuracy.
- Security Measures: Incorporates encryption, role-based access control, and privacy protections to secure sensitive data globally.
- Operational Alignment: Governance practices integrate seamlessly with workflows, supporting day-to-day operations and reporting requirements.
5.1 Compliance and Governance Requirement
Ensuring compliance with industry regulations, internal governance, and data protection standards such as GDPR and ISO 27001 is paramount. Regular audits, risk assessments, and a robust data governance framework will underpin these efforts. Reporting practices will incorporate legal, commercial, and regulatory requirements to maintain data quality and integrity.
5.2 Data Governance Principles
Data Governance in BMT is governed by our Data Governance Principles.
 |  |  |  |
| Strategic | Standard | Simple / Flexible | Secure |
| Data is a strategic asset for BMT The data needs of the many outweighs the needs of the few. The quality, integrity and accuracy of data is a critical and ongoing business issue. | Align with industry best practice. Integration across core BMT systems. | The pace of change for our systems will never be slower than it is today. Single source of data truth. | Globally and nationally secure data. Responsibly use our data. |
Data Governance Principle 1 – Federated Data Governance Model
Regional businesses adhere to a centralised set of governance standards for core and common systems. Local deviations are permissible when they provide competitive advantages, provided they do not compromise global collaboration, communication, or data security.
Data Governance Principle 2 – Defined Roles and Responsibilities
Clear definitions for governance roles, including Data Owners (accountable for data quality and access) and Data Stewards (responsible for day-to-day data management), ensure effective governance across the organisation.
5.3 Data Governance Coverage
Our Data Governance framework provides a comprehensive structure to ensure the effective management, compliance, and ethical use of data across the organisation. This framework governs all data activities within the Data Warehouse and Data Marts, enabling operational excellence and informed decision-making. Key elements include:
Lifecycle Management:
Data is managed through its entire lifecycle – Create, Read, Update, and Delete (CRUD)ensuring that data processes align with operational needs, compliance requirements, and organisational objectives.
Data Classification:
All data is classified based on sensitivity, usage, and regulatory requirements. This tailored approach ensures appropriate access controls, data protection measures, and compliance with laws and standards.
Data Impact Assessment (DIA):
A systematic evaluation of potential risks and implications associated with key data activities, including:
- Introducing new data sources.
- Sharing data with internal or external stakeholders.
- Implementing new models, reports, or processes.
The DIA process ensures that risks are identified early and addressed effectively, enhancing compliance, transparency, and trust.
Access and Security Controls:
Policies and technologies ensure the right users access the right data at the right time, supported by role-based permissions, audit trails, and monitoring to prevent unauthorised use.
Data Quality Assurance:
Regular validation of data ensures accuracy, consistency, completeness, and integrity. Automated monitoring and manual reviews uphold trust in the data for critical decision-making.
Regulatory and Compliance Alignment:
Governance policies are aligned with relevant laws, regulations, and standards (e.g., GDPR, HIPAA, FRS102) to mitigate risks and ensure ethical and lawful data usage.
Auditing and Monitoring:
Comprehensive logging and auditing processes provide visibility into data activities, supporting both internal oversight and external audits.
Stewardship and Accountability:
Designated Data Stewards and Owners ensure accountability for data governance at every stage of the data lifecycle. This stewardship fosters a culture of ownership, responsibility, and continuous improvement.
5.4 Data Quality
To derive maximum value from our data, BMT ensures and assures data quality through the following measures:
- Data Definitions:
- Centralised in a Data Dictionary, definitions include taxonomies, measures, metrics, and KPIs, promoting consistency and coherence.
- Data Warehouse Design:
- Documented pipelines from sources to Data Marts.
- Configuration-managed code following a three-stage deployment pipeline (Development, Testing, and Production).
- Data Quality Framework:
- Consistency: Data remains uniform across sources and reports.
- Accuracy: Real-world values are reflected, with timestamps and provenance documented.
- Validity: Data adheres to defined formats and data type requirements.
- Uniqueness: Checks ensure no duplicate entries for transactions, customers, or suppliers.
- Completeness: QA activities confirm all necessary data is present for its intended use.
- Timeliness: Data availability aligns with business requirements, typically updated daily.
- Quality Monitoring and KPIs:
- Continuous monitoring through automated checks, manual validations, and dashboards tracking quality metrics.
- Data Sampling:
- Regular sampling ensures data quality at scale, reducing reliance on exhaustive validation.
Data Governance Principle 3 – Unified Approach
The governance framework aligns with a single ERP system, reducing regional differences while maintaining flexibility through a federated model.
Data Governance Principle 4 – Data Quality Assurance
Emphasises six dimensions of data quality, with automated monitoring and KPIs to ensure reliability and accuracy.
5.5 Metadata Management
A robust metadata management system supports consistent understanding and usage of data:
- Central Metadata Repository: Captures lineage, tagging, and categorisation to provide context and traceability.
- myBMT Catalogue acts as a repository for structured metadata, providing a single point of reference for data tables, objects, and their categorisation within the medallion architecture.
- KnowHow complements myBMT by capturing procedural knowledge, such as transformations, usage guides, and best practices, contextualising the metadata.
- Lineage Tracking: Ensures all data transformations and movements are documented.
- While myBMT might not currently offer detailed lineage tracking, it does provide visualisations of the data flow through layers Bronze, Silver, and Gold
- While KnowHow may not explicitly track lineage, it documents workflows and methodologies, offering insight into how data is processed.
- Tagging System: Improves discoverability and enhances governance.[SW1]
- myBMT provides tagging to include domain-specific keywords or usage contexts.
- KnowHow uses categories and tags for its posts (e.g., associating blog entries with related datasets or processes), to enhance discoverability.
[SW1]How will be do this? Is this done already?
5.6 Data Security and Privacy
Our governance framework incorporates secure-by-design principles to protect data:
- Encryption: Protects data in transit and at rest.
- Azure automatically encrypts data at rest in both Blob Storage and Azure SQL Database using Azure Storage Service Encryption (SSE) and Transparent Data Encryption (TDE), respectively.
- Endpoint Detection and Response (EDR): All Enterprise Applications within our network or cloud infrastructure shall utilise EDR. For Enterprise Applications supported by a 3rd party i.e. SaaS we shall require evidence of EDR for bi-directional data flows or only flow data out to these applications to reduce the cyber risk of unprotected systems.
- Identity and Access Management (IDAM): Access to Business Data within the Data Warehouse or within other Enterprise Applications for Business Report creation or Self-Service analysis will be restricted. Access will be managed using our Enterprise IDAM systems utilising Single Sign and Multi-Factor Authentication (SSO and MFA) as a minimum to control access, assure identity of individuals and protect our data.[SW1]
- Role-Based Access Control (RBAC): Ensures users can access only the data required for their roles.
- Personally Identifiable Information (PII) Data Management:
- PII is limited to what is necessary.
- Obfuscation, pseudonymisation, and summarisation techniques are applied to protect sensitive employee and customer data.
Data Governance Principle 5 – Security Measures
Incorporates encryption, role-based access control, and privacy protections to secure sensitive data globally.
[SW1]Two bits to add to Knowhow if these are correct.
5.7 Change Management
To mitigate risks during updates or changes, a robust change management framework is employed:
- Version Control: All changes to data models, pipelines, and reports are tracked and logged.
- Approval Processes: Updates require formal approval to ensure alignment with governance policies.
- Rollback Mechanisms: Enable quick restoration to previous states in case of issues.
5.8 Operational Integration
Operational workflows are aligned with governance practices to ensure seamless implementation:
- Business Alignment: Governance supports day-to-day workflows, ensuring that operational and reporting needs are met.
- Collaborative Workflows: Teams across regions and functions adhere to consistent governance standards.
Data Governance Principle 6 – Operational Alignment
Governance practices integrate seamlessly with workflows, supporting day-to-day operations and reporting requirements.
Reporting Tools and Technologies
5.1 Reporting Tools and Technologies Requirements
Reports should be accessible and optimised for viewing on desktop and mobile devices. Ensure a responsive design for a consistent user experience across devices.
5.2 Reporting Framework and Tools
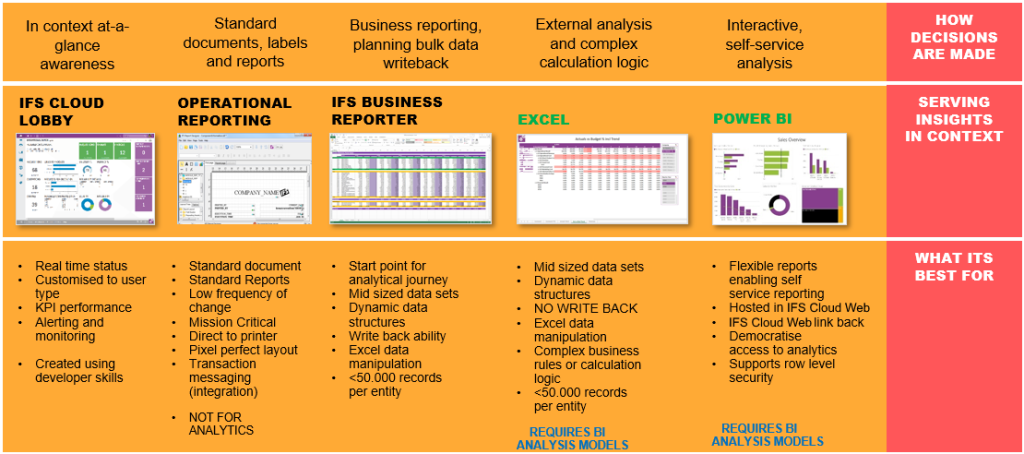
The Reporting Framework (repeated at Figure 6.1) identified 4 typical reporting methods:
5.3 In-System Data Reports and Lobbies
For many users and business roles the primary means of accessing data will be directly from the Enterprise Application itself. Where available such as in IFS Cloud in-system reports will enable users to view tabular data on screen and export to CSV or XLSX format for further analysis or sharing. In-System Lobbies typically allow less manual export but are useful to interact with the application and workflow steps directly such as in IFS Cloud. The available standard options for IFS Cloud are shown at Figure 6.2
Reporting Tools Principle 1 – IFS Cloud Reporting and Analysis Solutions
Where available we will utilise IFS Cloud standard reporting and analysis solutions to support our operational reporting needs from IFS Cloud.
5.4 Power BI Data Visualisation
Our office technologies are all based around a Microsoft Technology Stack whether this be in Microsoft 365 or Azure Cloud Services. This technology stack provides us a unifying on-premises and cloud infrastructure underpinned by a robust security model to protect our data and that of our customers.
Reporting Tools Principle 2 – Microsoft Technologies for Business Reporting
Due to the wide range of tools on offer across the market we will primarily use Microsoft tools as part of our infrastructure. Where there is a reason to deviate for cost-effectiveness, a unique feature or some other compelling reason provided the security of our data is ensured we will consider alternatives a case-by-case cost benefit analysis.
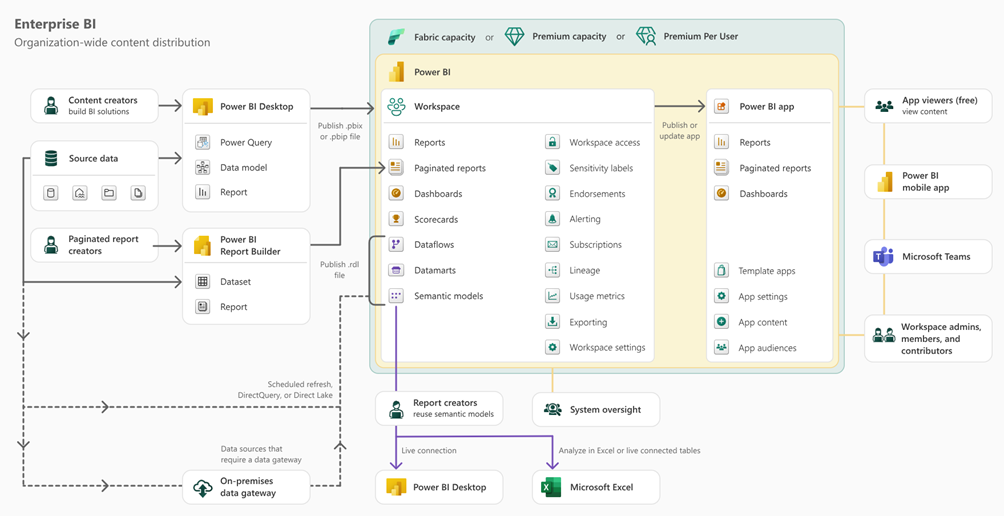
The overall use of Microsoft Tools for organisation-wide content distribution is shown at Figure 6.3 and is based on the standard Microsoft Enterprise BI usage scenario.
Figure 6.3 depicts the following user actions, tools and features which was modified from the example Microsoft scenario. This setup enables effective development and distribution of Power BI data visualisations in the form of Business Reports.
5.5 Self-Service Data
For a small number of business roles there is a requirement to perform ad hoc analysis on the underlying datasets. We support this in two ways:
- Utilising the configuration in Figure 6.3 report creators can utilise Power BI desktop or Microsoft Excel to connect directly to the Workspace Semantic Models to perform further analysis.
- For IFS Cloud we will enable the use of IFS Business Reporter for reporting and analysis roles to conduct ad hoc analysis directly on IFS Cloud data.
5.6 Data Storage and Computing
To support the reduction in Scope 2 emissions from our premises we seek to make use of cloud hosted services in the future. As well as having a smaller environmental footprint these services are more effective for us to collaborate via particularly with a highly mobile and hybrid workforce. Utilising cloud services also provides access the High-Performance Compute (HPC) capabilities that would not be cost effective for all parts of BMT to be able to run predictive analytics.
Reporting Tools Principle 3 – Microsoft Azure for Data Lakes, Warehouses and Marts
We will build all Data Lakes, Data Warehouses and Data Marts for Business Information in the Azure Cloud. Initially this is built upon Microsoft Azure Data Factory and Azure Synapse but we will continuously review the latest platforms and continually seek to migrate to reduce technical debt in the medium to long-term.
Data Modelling and Transformation
(Redrafted for Alignment with Data Operations Plan)
Key Takeaways
- Accuracy and Timeliness: Reports must use reliable, up-to-date data, refreshed at least every 24 hours.
- Data Marts: Serve as the foundation for consistent and reusable datasets across reports.
- Common Data Model (CDM): Ensures consistency and coherence by standardising data structure and relationships.
- Global Currencies: Consolidation and currency handling must align with global reporting standards.
- Validated Transformations: Enterprise-level data aggregations should occur in Data Marts to ensure consistent usage. Summation of data will typically be conducted in the Power BI report.
- Source Control: Version control ensures robust data governance for Data Marts, datasets, and reports.
- Historical Trends: Key data is periodically snapshot for trend analysis.
7.1 Data Modelling and Transformation Requirements
The following requirements have been identified relating to Data Modelling and Transformation:
- Data Accuracy and Timeliness: Reports must present accurate and up-to-date information from reliable sources. Ensure that data refresh rates align with business needs for timeliness.
- Performance and Scalability: Reports should load efficiently, even with large datasets. The system must scale to accommodate increased data volume over time.
- Cross-Functional Integration: The reporting system should seamlessly integrate data from various business functions. Ensure consistency and coherence in cross-functional reporting.
7.2 Reporting Framework and Data Transformation
The Reporting Framework (repeated at Figure 7.1) identified 3 typical data types used in various levels of reporting. It is recognised that elements of all 3 are valid for all use cases.
7.3 Data Structure
Within BMT, we typically utilise data from more than one source for reporting. Pipelines are used within the Data Warehouse or as feeds into Datasets or Data Marts. Reports are fed from Data Marts (or data models) in ways that:
- Enable multiple reports to work simultaneously on the same data.
- Allow datasets to be updated incrementally or in bulk, depending on the source and volume.
- Support multiple report developers.
- Reduce the risk of BI/Report Developers altering the data model.
Data Modelling and Transformation Principle 1 – Data Marts for Consistency
To improve reuse, assure quality, and speed up development, all reports will make use of datasets from Data Marts within the Data Warehouse. Data Marts are specified, and the Data Engineering team and Data Source SMEs source the required data to meet reporting needs.
Pipelines, datasets, and reports will be refreshed at an agreed schedule, typically once daily. Reports will clearly identify the last data refresh time.
Data Modelling and Transformation Principle 2 – Snapshot Data
Determine reporting frequency based on stakeholders’ needs. Establish regular reporting schedules for consistency and timeliness, with a minimum timeliness of 24 hours for complete refreshes. Users needing more immediate data should access application-specific reports or dashboards.
7.4 Common Data Model
The Common Data Model (CDM) facilitates the systematic analysis of disparate operational databases by:
- Standardising organisational data into a consistent format.
- Orchestrating data for ingestion (staging) and storage (Data Warehouse).
- Creating consumable Data Marts for:
- Business intelligence, data science, and analytics.
- Integrating disparate data sources.
- Rapid custom application development.
Business Architecture of CDM:
- Entities: Each CDM element corresponds to a key entity (e.g., Project, Employee, Customer).
- Key Attributes: Define essential information for each entity (e.g., Name, Date of Birth for Employees).
- Key Dimensions: Summarise and contextualise data for analysis (e.g., Job Family, Grade for Employees).
- Key Relationships: Identify connections between datasets (e.g., linking a Project Manager to Employee data).
- Key Facts: Represent measurable data (e.g., hours reporting, utilisation).
Data Modelling and Transformation Principle 3 – Common Data Model
All Data Marts will align with the BMT CDM approach to standardise data structures across systems.
7.5 Consolidation and Handling Global Currencies
Consolidating data across regions must include consistent handling of global currencies. Metadata tagging and lineage tracking will ensure accurate currency conversions and reporting consistency.
Data Modelling and Transformation 6 – Currency Handling in Data Warehouse
Includes provisions for consistent handling of multi-currency data and metadata tracking for accurate exchange rate management. With the Data Warehouse and Data Mart views transferring local and consolidated currencies for reports. Where a further currency conversion is required this will be handled within the Business Report itself.[SW1]
[SW1]I’ve added this section. Can you check it please?
7.6 Transformation of the Data
Data transformations, of commonly used metrics, primarily occur at the Data Mart level to ensure consistency across reports. Transformations applied directly within reports are not validated for enterprise use but may be acceptable for local purposes. While summations and aggregations are commonly performed in Power BI for visualisation purposes, Data Marts can be enhanced to pre-aggregate or summate data.
These pre-computed results can:
- Improve the performance of reports by reducing runtime calculations.
- Enable advanced aggregation methods (e.g., weighted averages, forecasted totals) that standard tools may not easily support.
Incorporating aggregations into Data Marts ensures consistency, scalability, and alignment with strategic insights.
Machine Learning (ML) models integrated into the Data Warehouse infrastructure can generate summarised datasets, these are incorporated into the Data Marts as an additional data source.
Data Modelling and Transformation Principle 4 – Enterprise Data Transformations
Enterprise-level data aggregations should occur in Data Marts to ensure consistent usage. Summation of data will typically be conducted in the Power BI report. Where a separate model, such as ML, is used to predict or prescribe a likely outcome this data will form an additional data source.[SW1]
[SW1]The draft text was contradictory. We said that the all enterprise-level data transformaiton happen in a view expect for aggregations or summations that happen in PowerBI. I’ve amended the key takeaway, is that correct now?
7.7 Source Control
Data Marts
Configuration and Version Control:
Data Mart views are configured with SQL code snippets managed under strict version control within the Data Warehouse.
- Source Control Repository: All SQL code is stored in a centralised DevOps-based repository to track changes, maintain history, and enable collaboration.
- Branching and Approval Processes: Development follows a branching strategy (e.g., feature, development, and production branches), with mandatory peer reviews and automated quality checks before merging into production.
- Deployment Pipelines: Changes to Data Mart views are deployed using automated CI/CD pipelines, ensuring seamless updates to production environments with minimal downtime.
Documentation:
Each Data Mart view is accompanied by comprehensive metadata and documentation, including:
- Purpose: The business question(s) it addresses.
- Source Tables: Detailed mapping to the source tables and fields.
- Transformation Logic: A clear explanation of all transformations applied.
- Ownership: The accountable team or individual.
Audit Trails:
A robust audit trail captures all changes, including who made the changes, when, and the reasons for the update.
Role of EXEC get.myview in the DataMart Source Process
Centralised View Retrieval:
get.myviewacts as a stored procedure or function that retrieves pre-configured views or queries from a central repository.- Simplifies the process of accessing DataMart views by abstracting away the underlying SQL logic and transformations.
- Ensures consistency by enforcing the use of pre-approved query templates.
Configuration Control
- Views managed through
get.myvieware likely stored and version-controlled in the database or alongside the Data Warehouse’s configuration management process. - This approach ensures all changes to the DataMart views go through a controlled process, maintaining integrity and traceability.
Simplified Maintenance
- By encapsulating query logic within a procedure like
get.myview, updates or optimisations to the view logic can be made in a single location without requiring changes to consuming applications or downstream systems.
Integration with DataMart Processes
get.myviewcan be invoked as part of the pipeline or DataMart orchestration process to dynamically retrieve views based on parameters such as schema, view name, or user role.
Enhanced Security and Governance
- EXEC
get.myviewmethod allows for centralised control over who can execute which views, as permissions can be managed at the procedure level. - Audit trails can be implemented to log when and by whom the procedure was executed.
Documentation and Standardisation
- Using a procedure like
get.myviewenforces a standardised method for accessing views, which simplifies documentation and reduces onboarding time for new team members. - The procedure parameters and outputs can be documented, ensuring clarity for developers and analysts.
Business Reports
Where a report is generated by the central BI Team the PBIX or report file is to be held in the Business Intelligence Team Site.
Where a report is generated by another team the PBIX file is to be held in a suitable Teams environment.
In-System Reports
Where an in-system report is created or modified the code snippet used with be version controlled and held in the G-MIS project DevOps repository.
In-System Lobby
Where an in-system lobby has elements that are created or modified the code snippet used with be version controlled and held in the G-MIS project DevOps repository.
7.8 Data Warehouse Historic Data
Periodic snapshots of key data tables enable historical trend analysis. Only dataset views used in reports are retained to provide meaningful trends while minimising storage overhead.
Refer to: Get myHistory
7.9 In-System Reporting
Where available, in-system reports or dashboards are used for displaying data. These rely on the application’s standard data model, with minimal additional transformation needed.
Report Design Guidelines
8.1 Report Design Guidelines Requirements
Users should be able to drill down into detailed data for deeper insights. Provide interactive features for data exploration and analysis.
8.2 Style Guide
A standardised reporting layout, structure and use of visuals is essential to enable users of Power BI reports across BMT seamlessly move between reports. To achieve this a Reports Style Guide based on best practice for User Experience (UX) design and corporate guidelines is available from the Business Intelligence Team.
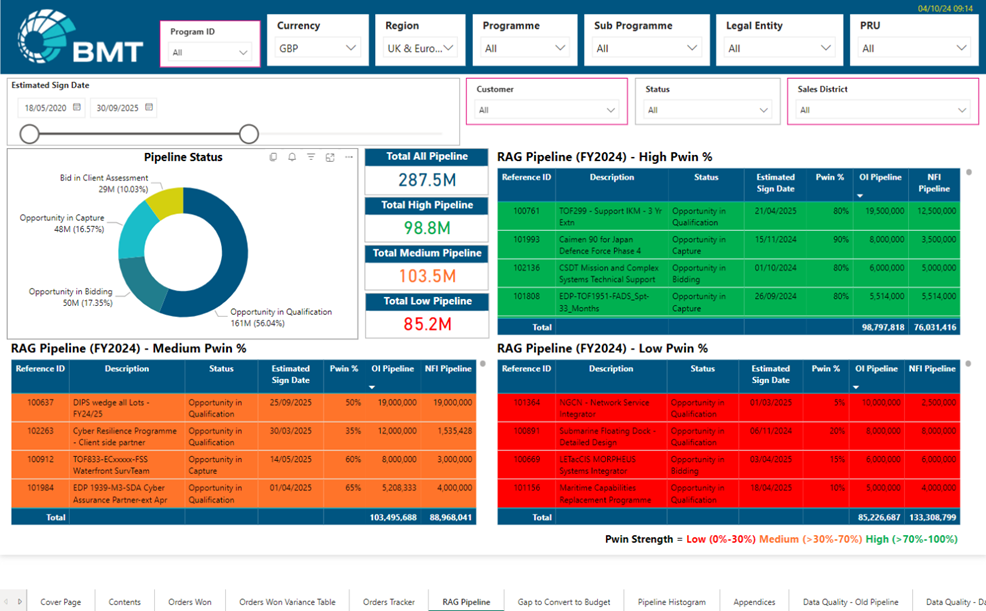
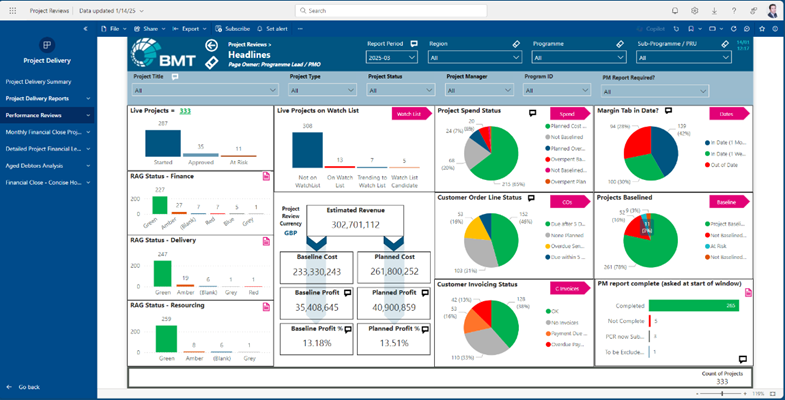
In the example at Figure 8.1 a consistent approach to slides to enable users to drill down for deeper insights is achieved. Utilising the interactive features of the Power BI users can conduct their own data exploration and analysis.
Business Owners requiring reports should consider the business needs and the user experience when specifying their reports. The Business Intelligence Community have experts in BI Development to support with report layouts and visualisations. The aim is to have the smallest number of individual report pages and to utilise slicers and other ways to explore and analyse the data.
Report Design Principle 1 – All Reports will utilise the Report Style Guide and being developed by the central Business Intelligence Community
To provide a common approach across business reporting and to reduce the number of duplicate reports all reports will be developed by the central Business Intelligence community. The BI community comprises of subject matter experts and BI developers with access to the correct tools and style guides to develop consistent reports for data consumers.
Security and Access Control
(Redrafted for Alignment with Data Operations Plan)
Key Takeaways
- Role-Based Access Control (RBAC): Access to sensitive data is restricted based on roles, geography, and organisational requirements.
- Secure-by-Design Principles: All systems and reports are developed with confidentiality, integrity, and availability in mind.
- PII Protection: Steps are taken to obfuscate, pseudonymise, or anonymise personally identifiable information (PII) to ensure privacy and compliance.
- National Data Restrictions: The Global Data Warehouse will not access or store nationally protected data or data with residency/sovereignty conditions.
- Row-Level Security (RLS): Geographic and role-based filters ensure users only see data relevant to their responsibilities.
9.1 Security and Access Control Requirements
- Role-Based Access Control (RBAC): Implement controls to restrict access to sensitive data. Ensure secure data transmission and storage.
- Collaboration and Sharing: Enable users to share reports and insights securely, with options for exporting data in approved formats.
- User Accessibility: Ensure users can easily access relevant reports through a user-friendly interface tailored to their roles.
9.2 Security and Controlling Access
All of our systems, data sources, data warehouses, data marts and reports are developed considering confidentiality, integrity and availability (CIA Triad). The CIA Triad is an important concept in Information Security including ISO27001 and data protection such as EU GDPR.
Application-Level Security
Security is managed individually for each application. Wherever possible, segregation of duties and access controls are implemented to maintain data integrity and validity.
Global Data Warehouse Security
The Global Data Warehouse will not store or process nationally protected data or data subject to residency/sovereignty conditions.
Security and Access Principle 1:
For the avoidance of doubt, BMT will not share any nationally protected data or data with specific residency or sovereignty requirements. The Data Warehouse will focus on holding BMT Management Information, along with employee and customer data necessary for legitimate business purposes.
The Global Data Warehouse will employ secure-by-design principles to ensure:
- Access to the Data Warehouse is restricted to a core team in GBS IT.
- Changes to Data Models and Data Mart views are limited to the Data Engineering Team.
- All data transfers are secured using Secure File Transfers, protected APIs, or Secure Gateways.
Data Marts Security
Access to Data Marts is designed to:
- Promote broader use of reports while protecting sensitive data such as PII.
- Data Mart views will obfuscate, anonymise, or pseudonymise data as required.
Examples:
- A utilisation report shows employee absences but obfuscates specific reasons (e.g., stress, injury), summarising data into general categories such as “Sick Leave.”
- Regional management packs summarise employee trends without revealing individual details.
Security and Access Principle 2:
Data Mart views will obfuscate, anonymise, or pseudonymise data as required.
Business Reports Security
Business Report Security has been developed using Secure-by-Design principles, reports use geography and role to determine access.
All Business Reports whether in Power BI, In-System Reports or In-System Lobbies will use Role Based Access. Some reports will be available to all employees.
Row Level Security is used is used to filter the content within a Business Report. Typically this is used to limit regional data to a particular region enabling a single Business Report to be both Global and Regional concurrently.
Microsoft Entra identities are used to:
- Synchronise access with the Global Tenant.
- Enable Row Level Security (RLS) for geographic or departmental restrictions.
Security and Access Principle 3 – Role Based Access and Row Level Security on Business Reports
Role-based access ensures permanent BMT employees only see reports aligned with their job functions. Data may be filtered further by region, country, or legal entity.
9.3 Personally Identifiable Information
To meet national Data Protection requirements and maintain compliance with data privacy regulations, only the minimum necessary Personally Identifiable Information (PII) should be shared into the Data Warehouse. Where there is a legitimate business need to consolidate and process PII, we will ensure that PII is processed and accessed only when absolutely necessary and with appropriate safeguards by:
- Data Segregation: Creating dedicated pipelines, Data Marts, Workspaces, and Reporting structures for handling PII, ensuring tighter access controls.
- Access Controls: Implementing separate security groups with restricted access to reports and datasets containing PII. Only authorised individuals with a clear business requirement will have access to this information.
- Row-Level Security (RLS): Providing global datasets with identifiable region, legal entity, or team, to ensure report content designers can restrict users by policy, so users can only access data relevant to their role, effectively hiding unrelated PII.
- Data Protection Impact Assessment (DPIA): For reports or processes involving PII, conducting a DPIA to assess and mitigate risks, ensuring that privacy concerns are identified and addressed proactively.
Security and Access Principle 4 – Restricted Access to Personally Identifiable Information (PII)
PII is shared only when absolutely necessary. For reports requiring PII, dedicated pipelines, Data Marts, workspaces, and access controls are implemented.
Distribution and Delivery
10.1 Distribution and Delivery Requirements
Development of Reports: Reports shall follow a lifecycle management approach to ensure that changes to reports do not impact live reports.
User Searchability: Users should have a range of options to utilise reports from ad-hoc searches to inclusion in meetings.
Alerts and Notifications: Implement alerting mechanisms to notify users of significant changes or thresholds. Allow users to set up personalised notifications based on their preferences.
10.2 Reporting Framework and Delivery
The Reporting Framework (repeated at Figure 10.1) identified different timeliness requirements.
To ensure users are able to identify the data or insights they require and to act on them our development and delivery of Business Reports must align to the timeliness needs.
10.3 Development of Reports
For all reports and datasets whether in an Enterprise Application like GMIS or within the Data Warehouse or part of Power BI Reporting it is essential that new reports do not impact existing ones. The delivery model needs to adopt an agile approach with incremental improvements being made to business reports as datasets and requirements change. To provide business continuity and to ensure that live reports are not affected by updates we need to adopt a two or three phase deployment pipeline following a DevOps approach. This discipline allows us to test changes before deployment and enables iterative improvements to be deployed quickly when necessary.
Distribution and Delivery Principle 1 – Development Lifecycle for Datasets and Reports
Across our Enterprise Applications, Global Data Warehouse, Data Marts and reports two or three deployment pipelines will be used. This ensures a separation between Development, Testing and Production versions of datasets and reports.
10.4 Delivery of Reports
To ensure reports meet user timeliness requirements and are transparent all reports will show the last time they were updated. It is necessary to ensure that data pipelines either follow automated event scheduling i.e. the next update happens once the previous stage is complete or follow a pre-agreed schedule.
In some cases summarised data is generated within the Enterprise Application itself on a weekly basis. Similarly some activities like updating Financial Close only happens once per Accounting Period / Month. The refresh of the Business Report will align with the refresh of the underlying data.
Users should also be able to self-service their access to Business Reports whether in-system or via Power BI. For Power BI users will self-service their access via the Business Reporting Hub on NAVIGATOR.
Distribution and Delivery Principle 3 – Self Service Reports
Users will select the Power BI Business they require via the Business Reporting Hub.
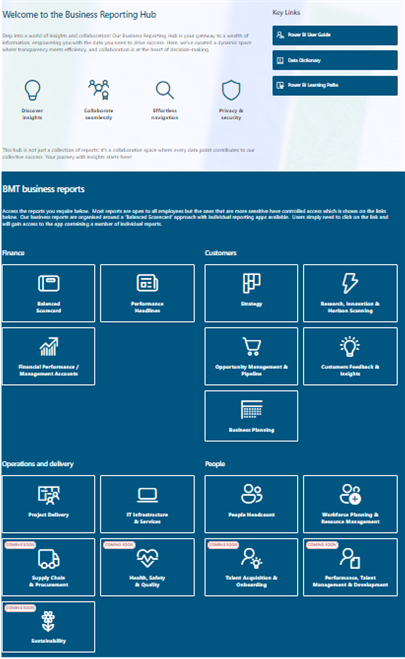
10.5 Business Reporting Hub
Reports will be developed and provided in several potential ways from Power BI Apps, integrated within Teams channels or on SharePoint pages. We will make reports available to users which can be shared. Our use of SharePoint and PowerBI will enable as single source of truth regardless of how the user access the reports.
To improve collaboration and use of Business Reporting we will establish a central Business Reporting Hub on NAVIGATOR. The Business Reporting Hub should provide insight on how to access reports and direct users to key ones relevant to their roles or areas of interest. To improve collaboration SharePoint Report Pages will contain a number of individuals Power BI Reports with pages to enable users to find relevant information.
The Business Reporting Hub will consist of 2 major parts.
Welcome: A short introduction explaining the purpose of the hub and introducing the key people.
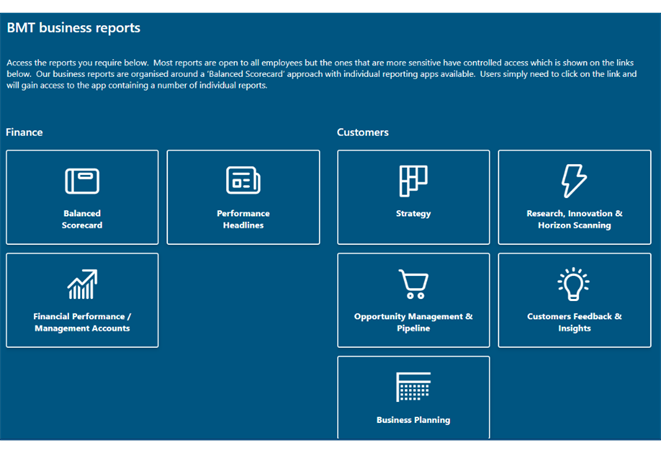
Business Reports: Build around a Balanced Scorecard approach links to reports for users to access. Most are available to all employees, but some are sensitive and access is limited.
Distribution and Delivery Principle 4 – Business Reporting Hub
All Business Reports will be part of an integrated package and accessible via the Business Reporting Hub.
10.6 User Accessibility
Users will access officially packaged content distributed and updated as a Power BI Apps. Apps are created in workspaces and published to large groups or the entire organisation. An App can combine reports bundled together to allow users to access multiple reports around a similar topic at once. A user will likely need several pages depending on their role and this approach allows users to self-service and access these reports themselves. When changes are made by the author the users of the pages are notified of the update and changes are applied automatically.
- Users can access related Reports and Pages via the menu.
- Users interact with the report in real time from within the App.
10.7 Alerts and Notifications
Users who use an app will be notified when a change is made to the report such as when the app is updated. These notifications are via email.
Within an App a user can choose to subscribe to a report. You will get an email about the report on a schedule the user determines with a snapshot and link to the report.

Users can also setup alerts on reports visuals such as gauges, KPIs and cards. Users can add alerts for particular thresholds and conditions. Alerts are personal and will be either emailed or sent via Teams.

10.8 Further Access Options
Business Leaders will also be able to present reports or provide links to them in different ways.
Embedding in SharePoint Pages
Individual reports can be embedded into SharePoint pages to help explain specific reports. Additionally entire lifecycles such as the opportunity management lifecycle can be shown within SharePoint pages to help sign post individuals to reports and other key information such as training material and points of contact.
Inclusion in Teams Channels
Power BI reports can also be presented as a tab in a Teams Channel. This can help promote the importance of a particular report to the Team or Channel. Access to the Team does not automatically grant access to report.
Insertion into PowerPoint Presentations
Where a meeting such as the Business Plan Review (BPRs) makes use of reports these reports can be inserted into a presentation. This provides a live and interactive link to the report. Where records are needed the presentation can be saved as a PDF to present a record.
Training and User Support
11.1 Training and User Support Requirements
Develop training programmes to help users effectively utilise reporting tools. Establish a support system for addressing user queries and issues.
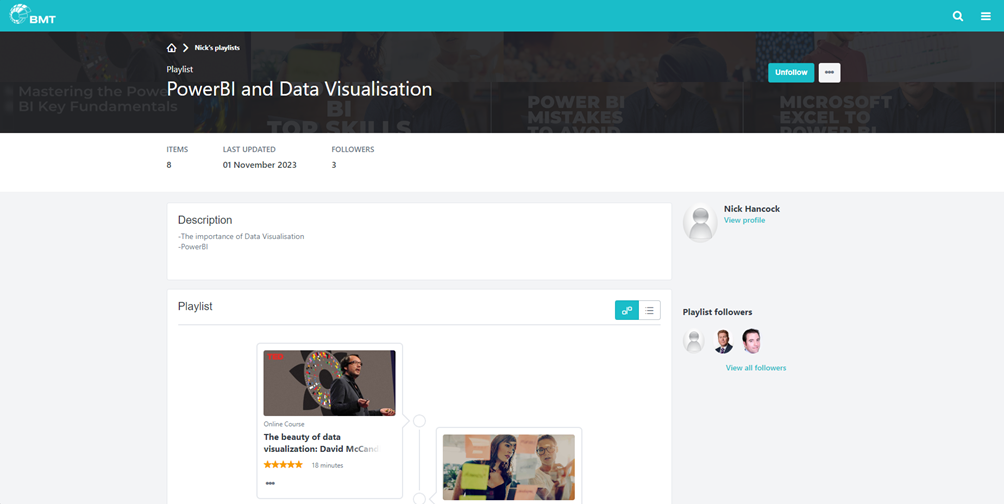
11.2 Training
To support the digital skills development of user the Power BI and Data Visualisation is generally applicable to new users or users who are new to this area. The Learning Path is implemented in the Performance Portal and will be reviewed based on user feedback and available content, Figure 11.1.
11.3 User Support
Users will be able to leave feedback for broken links, error etc. which can be reviewed and actioned by a suitable lead.
Change Management
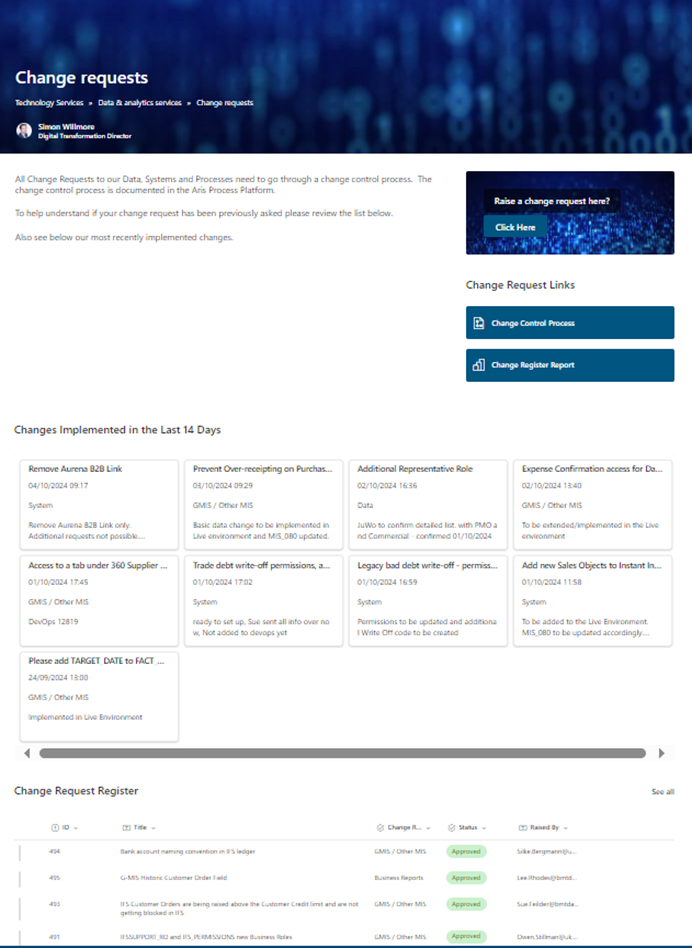
12.1 Change Management Process
Change Management is implemented with a single process covering changes to Data, Systems and Processes. Users are able to raise Change Requests which are then reviewed and actioned. At all points users are kept informed about their change requests.
All Change Requests are logged centrally and are available to all users, Figure 12.1.
Scalability and Future Expansion
13.1 Futureproofing with Microsoft Fabric
As Microsoft transitions to Fabric, an integrated end-to-end analytics platform, BMT must prepare to leverage its features effectively. The following steps will ensure readiness:
- Pilot Testing: Initiate sandbox environments to explore Microsoft Fabric’s capabilities and assess compatibility with existing systems.
- Impact Assessment: Evaluate the potential impact of Microsoft Fabric on current Data Warehouse and Data Mart structures.
- Training and Upskilling: Provide training for Data Engineering and Business Intelligence teams to understand and use Fabric’s tools effectively.
- Incremental Transition: Develop a phased migration plan to adopt Fabric, starting with non-critical workloads.
- Continuous Review: Regularly review Microsoft Fabric’s updates to align with BMT’s evolving analytics needs.
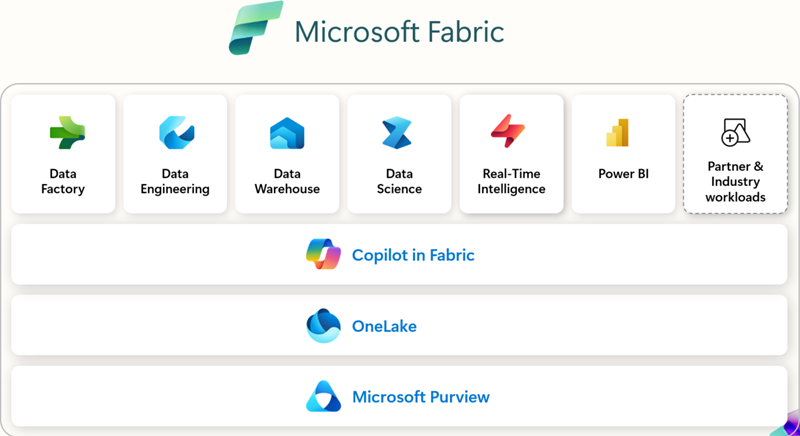
Fabric integrates workloads like Data Engineering, Data Factory, Data Science, Data Warehouse, Real-Time Intelligence, Industry solutions, Databases, and Power BI into a shared SaaS foundation. Each of these experiences is tailored for distinct user roles like data engineers, scientists, or warehousing professionals, and they serve a specific task.
The AI-integrated Fabric stack accelerates the data journey and offers the following advantages:
- Extensive integrated analytics
- Familiar and easy-to-learn shared experiences
- Easy access and reuse of all assets
- Unified data lake storage preserving data in its original location
- Centralised administration and governance
13.2 Advanced Analytics and Machine Learning
The Platinum layer is the foundation for advanced analytics, enabling the integration of predictive and prescriptive capabilities to drive intelligent decision-making across the organisation. To future-proof this layer, we will harness the power of Azure Machine Learning, Azure Synapse Analytics, and Azure Databricks to create a scalable, cloud-native environment for developing, deploying, and managing machine learning models.
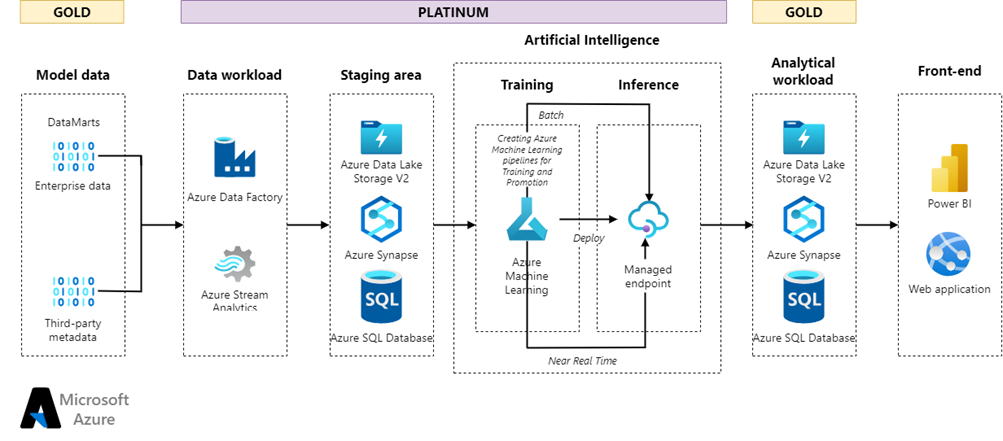
- Advanced Business Transformations:
- Complex Transformations: The Platinum Layer handles intricate data transformations that go beyond the scope of the Silver and Gold layers. These transformations include aggregations, financial modeling, and scenario analysis to support strategic decision-making.
- Business Logic Integration: This layer integrates sophisticated business logic to ensure that the data transformations align with organizational goals and strategies.
- Machine Learning and Predictive Analytics:
- ML Models: The Platinum Layer is where machine learning models are developed, trained, and validated. These models use historical data to make predictions about future trends, such as sales forecasts, customer behaviour, and budget requirements.
- Predictive Analytics: By applying ML algorithms, the Platinum Layer generates predictive insights that help the organization anticipate future scenarios and make data-driven decisions.
- Integration and Data Flow:
- Returning Views to Gold Layer: The outputs from the Platinum Layer, including transformed views and predictive insights, are returned to the Gold Layer. This ensures that these advanced analytics are readily accessible for consumption and integration into business processes.
- Continuous Feedback Loop: The Platinum Layer operates in a continuous feedback loop, where insights and models are constantly refined based on new data and changing business conditions.
- Opportunities:
- Predictive Analytics: Utilizing advanced machine learning models for predictive analytics and forecasting.
- Business Transformation: Leveraging data insights for strategic business transformations and decision-making.
- Collaboration with Data Scientists: Enhancing collaboration with data scientists to develop innovative solutions.
Conclusion
14.1 Key Points
In this section, we summarise the critical elements of the Reporting Strategy that have been discussed throughout the document.
- Data Governance: The strategy includes the implementation of data governance measures to ensure the accuracy, consistency, and coherence of data
- Microsoft-Based Technologies: Utilising Microsoft-based technologies for data engineering, visualisation and reporting.
- Common Data Model: Development of a common data model to standardise data across the organisation.
- Federated Data Model: Implementation of a federated data model where regional businesses follow a centralised set of data governance standards.
- Business Reporting Hub: Creation of a Business Reporting Hub on NAVIGATOR to provide insights and direct users to key reports.
- Role-Based Access: Users will be granted role-based access to reports, ensuring data security and relevance.
14.2 Benefits and Outcomes
This section outlines the advantages and expected results of implementing the Reporting Strategy.
- Enhanced Decision-Making: The strategy supports BMT’s drive for better data-driven decision-making by providing timely and descriptive analytics.
- Improved User Experience: The new website, CRM system, and mobile application will provide a better user experience with modern design and improved navigation.
- Operational Efficiency: The strategy aims to create efficiencies and add value to existing propositions by leveraging data to drive innovation.
- Customer Engagement: Enhanced customer engagement through improved access to services and insights.
- Data Security: Ensuring data security and privacy through role-based access and compliance with data governance principles.
- Scalability: The strategy is designed to support future growth and scalability, accommodating increased data volume over time.
The table below provides a concise overview of the key points and their corresponding benefits and outcomes.
| Key Points | Benefits and Outcomes |
|---|---|
| Data Governance | Enhanced Decision-Making |
| Microsoft-Based Technologies | Improved User Experience |
| Common Data Model | Operational Efficiency |
| Federated Data Model | Customer Engagement |
| Business Reporting Hub | Data Security |
| Role-Based Access | Scalability |
Overall, the Reporting Strategy provides a comprehensive and well-thought-out approach to managing and utilising BMT’s data to drive business growth and success. By implementing these measures, BMT can effectively leverage its data to create efficiencies, drive innovation, and add value to its existing propositions.
Annex A: High Level Reporting Requirements
These requirements have been derived to align with the Business Processes to shown alignment to the level 1 and level 2 processes arranged by business use case.
| ID | Use Case | Requirement | L1 Process | L2 Process | Metric and Purpose | Report Type | Business Owner |
|---|---|---|---|---|---|---|---|
| 1 | Statutory Reporting / Board | Campaign Summary | Opportunity Management | Lead Management | Summarise the number of leads generated, lead sources, and conversion rates. Provides the board with insights into the effectiveness of campaign strategies. | Power BI (Period) | Shane Amaratunga |
| 2 | Global / Regional Business Oversight | Lead Pipeline Overview | Opportunity Management | Lead Management | Tracks the status and volume of leads across regions. Helps business leaders monitor lead generation activities and identify high-potential markets. | Power BI (Daily) | Shane Amaratunga |
| 3 | Day-to-Day Reporting for Operational Tasks | Daily Lead Tracker | Opportunity Management | Lead Management | Details daily lead activities, including new leads, follow-ups, and lead status updates. Supports sales teams in managing and prioritizing leads. | In-System Report (Daily) | Shane Amaratunga |
| 4 | Ad Hoc Self-Service Needs | Custom Lead Analysis | Opportunity Management | Lead Management | Allows users to explore lead data, filter by various criteria, and generate custom insights. Supports ad hoc analysis and decision-making. | Self-Service (Custom) | Shane Amaratunga |
| 5 | Statutory Reporting / Board | Opportunity Qualification Summary | Opportunity Management | Opportunity Identification, Qualification and Capture | Provides an overview of qualified opportunities, including potential value and strategic alignment. Informs the board about high-value opportunities in the pipeline. | Power BI (Period) | Shane Amaratunga |
| 6 | Global / Regional Business Oversight | Opportunity Pipeline Dashboard | Opportunity Management | Opportunity Identification, Qualification and Capture | Monitors the status and progress of opportunities across regions, highlighting key metrics such as win probability and expected revenue. Helps business leaders manage the opportunity pipeline. | Power BI (Daily) | Shane Amaratunga |
| 7 | Day-to-Day Reporting for Operational Tasks | Sales Accounts Lobby | Opportunity Management | Opportunity Identification, Qualification and Capture | Tracks the qualification status of opportunities, including key criteria and next steps. Assists sales teams in prioritizing and advancing opportunities. | In-System Lobby (Live) | Shane Amaratunga |
| 8 | Ad Hoc Self-Service Needs | Opportunity Analysis Tool | Opportunity Management | Opportunity Identification, Qualification and Capture | Enables users to analyse opportunity data, such as qualification criteria and capture plans. Facilitates ad hoc queries and insights. | Self-Service (Custom) | Shane Amaratunga |
| 9 | Statutory Reporting / Board | Bid Status Summary | Opportunity Management | Opportunity in Bidding | Summarizes the status of active bids, including key milestones and financial metrics. Provides the board with visibility into ongoing bidding activities organized by risk level. | Power BI (Period) | Shane Amaratunga |
| 10 | Global / Regional Business Oversight | Bid Pipeline Dashboard | Opportunity Management | Opportunity in Bidding | Tracks the progress of bids across regions, highlighting key metrics such as bid value and win probability. Helps business leaders monitor and manage bidding activities. | Power BI (Daily) | Shane Amaratunga |
| 11 | Day-to-Day Reporting for Operational Tasks | Bid Manager Lobby | Opportunity Management | Opportunity in Bidding | Tracks opportunities in bidding assigned to a bid manager, sales account lead or head of programs. Also provides an overview of win rates, win/loss reasons over the past 12 months. | In-System Lobby (Live) | Shane Amaratunga |
| 12 | Ad Hoc Self-Service Needs | Custom Bid Analysis | Opportunity Management | Opportunity in Bidding | Allows users to explore bid data, filter by various criteria, and generate custom insights. Supports ad hoc analysis and decision-making. | Self-Service (Custom) | Shane Amaratunga |
| 13 | Statutory Reporting / Board | Bid Outcome Summary | Opportunity Management | Bid in Client Assessment & Opportunity Closure | Provides an overview of bid outcomes, including win/loss rates and financial impact. Informs the board about the success of bidding activities. | Power BI (Historic) | Shane Amaratunga |
| 14 | Global / Regional Business Oversight | Orders Won Dashboard | Opportunity Management | Bid in Client Assessment & Opportunity Closure | Tracks the conversion of bids into won orders. Shows win rate and trends behind win and loss reasons. | Power BI (Daily) | Shane Amaratunga |
| 15 | Ad Hoc Self-Service Needs | Closure Phase Analysis | Opportunity Management | Bid in Client Assessment & Opportunity Closure | Enables users to analyse closure phase data, such as final costs and performance metrics. Supports ad hoc queries and insights. | Self-Service (Custom) | Shane Amaratunga |
| 16 | Statutory Reporting / Board | Bid Approval Summary | Project Management | Bidding and Planning | Summarises key financial metrics and risk assessments for high-value bids. | Power BI (Period) | Guy Tomlinson |
| 17 | Global / Regional Business Oversight | Bid Pipeline Overview | Project Management | Bidding and Planning | Tracks the status and value of bids across regions. Helps business leaders monitor bid progress and identify potential bottlenecks. | Power BI (Daily) | Guy Tomlinson |
| 18 | Day-to-Day Reporting for Operational Tasks | Bid Progress Report | Project Management | Bidding and Planning | Details the progress of individual bids, including milestones achieved and upcoming deadlines. Supports bid managers in tracking and managing bid activities. | In-System Report (Daily) | Guy Tomlinson |
| 19 | Ad Hoc Self-Service Needs | Custom Bid Analysis | Project Management | Bidding and Planning | Allows users to explore bid data, filter by various criteria, and generate custom insights. Supports ad hoc analysis and decision-making. | Self-Service (Custom) | Guy Tomlinson |
| 20 | Global / Regional Business Oversight | Project Initiation Dashboard | Project Management | Initiate Project | Tracks the initiation phase of projects across regions, highlighting key milestones and resource allocation. Helps business leaders ensure projects start smoothly. Provides summary of Work at Risk exposure and current approvals granted. | Power BI (Daily) | Guy Tomlinson |
| 21 | Day-to-Day Reporting for Operational Tasks | Project Manager Lobby | Project Management | Deliver Project | Provides an overview of all projects from initiation to pending closure. Gives an oversight of project finances, outstanding timesheets, customer invoices, supplier insights, project baselines and project KPIs. | In-System Lobby (Live) | Guy Tomlinson |
| 22 | Ad Hoc Self-Service Needs | Initiation Phase Analysis | Project Management | Initiate Project | Enables users to analyse initiation phase data, such as resource allocation and initial costs. Supports ad hoc queries and insights. | Self-Service (Custom) | Guy Tomlinson |
| 23 | Global / Regional Business Oversight | Project Delivery Dashboard | Project Management | Deliver Project | Monitors project delivery metrics across regions, including progress against milestones and resource utilisation. Helps business leaders manage project execution. | Power BI (Daily) | Guy Tomlinson |
| 24 | Ad Hoc Self-Service Needs | Delivery Phase Insights | Project Management | Deliver Project | Allows users to drill down into delivery phase data, such as task performance and resource usage. Facilitates ad hoc analysis and reporting. | Self-Service (Custom) | Guy Tomlinson |
| 25 | Statutory Reporting / Board | Project Closure Summary | Project Management | Close Project | Provides a final overview of completed projects, including financial performance, lessons learned, and post-project evaluations. Informs the board about project outcomes. | Power BI (Period) | Guy Tomlinson |
| 26 | Global / Regional Business Oversight | Project Closure Dashboard | Project Management | Close Project | Tracks the closure activities of projects across regions, including final deliverables and resource release. Helps business leaders ensure projects are closed properly. | Power BI (Daily) | Guy Tomlinson |
| 27 | Ad Hoc Self-Service Needs | Closure Phase Analysis | Project Management | Close Project | Enables users to analyse closure phase data, such as final costs and performance metrics. Supports ad hoc queries and insights. | Self-Service (Custom) | Guy Tomlinson |
| 28 | Statutory Reporting / Board | Work at Risk Summary | Project Management | Initiate Project | Summarises the amount of Work at Risk being undertaken to understand the level of risk being taken in any part of the business. | Power BI (Daily) | Guy Tomlinson |
| 29 | Statutory Reporting / Board | Talent Acquisition Summary | People Management | Recruit | Summarises key recruitment metrics such as number of hires, time-to-fill, and cost-per-hire. Provides the board with insights into recruitment efficiency and effectiveness. | Power BI (Period) | Gudrun Neumann |
| 30 | Statutory Reporting / Board | Employee Engagement Summary | People Management | Engage | Summarises employee engagement metrics such as survey results, participation rates, and engagement scores. Provides the board with insights into employee satisfaction and engagement levels. | Power BI (Period) | Gudrun Neumann |
| 31 | Statutory Reporting / Board | Talent Development Summary | People Management | Develop | Summarises key talent development metrics such as training completion rates, skill assessments, and development program participation. Provides the board with insights into talent development efforts. | Power BI (Period) | Gudrun Neumann |
| 32 | Statutory Reporting / Board | Workforce Management Summary | People Management | Manage | Summarises key workforce management metrics such as headcount, turnover rates, and workforce diversity. Provides the board with insights into workforce composition and management. | Power BI (Period) | Gudrun Neumann |
| 33 | Statutory Reporting / Board | Exit Summary | People Management | Exit | Summarises key exit metrics such as exit interview results, reasons for leaving, and turnover rates. Provides the board with insights into employee exits and retention challenges. | Power BI (Period) | Gudrun Neumann |
| 34 | Global / Regional Business Oversight | Talent Pipeline Overview | People Management | Recruit | Tracks the status and volume of candidates in the recruitment pipeline across regions. Helps business leaders monitor recruitment activities and identify high-potential candidates. | Power BI (Daily) | Gudrun Neumann |
| 35 | Global / Regional Business Oversight | Engagement Dashboard | People Management | Engage | Tracks engagement activities and metrics across regions, highlighting areas of high and low engagement. Helps business leaders monitor and improve employee engagement. | Power BI (Daily) | Gudrun Neumann |
| 36 | Global / Regional Business Oversight | Development Program Dashboard | People Management | Develop | Monitors the progress and effectiveness of development programs across regions, highlighting key metrics such as skill improvement and program completion rates. Helps business leaders manage talent development initiatives. | Power BI (Daily) | Gudrun Neumann |
| 37 | Global / Regional Business Oversight | Workforce Dashboard | People Management | Manage | Tracks workforce metrics across regions, highlighting key areas such as employee retention, performance, and expense management. Helps business leaders manage workforce effectively. | Power BI (Daily) | Gudrun Neumann |
| 38 | Global / Regional Business Oversight | Exit Dashboard | People Management | Exit | Tracks exit metrics across regions, highlighting trends and patterns in employee departures. Helps business leaders understand and address retention issues. | Power BI (Daily) | Gudrun Neumann |
| 39 | Day-to-Day Reporting for Operational Tasks | Daily Recruitment Tracker | People Management | Recruit | Details daily recruitment activities, including new applications, interviews scheduled, and offers made. Supports recruitment teams in managing and prioritising tasks. | In-System Lobby (Live) | Gudrun Neumann |
| 40 | Day-to-Day Reporting for Operational Tasks | Engagement Activity Tracker | People Management | Engage | Details daily engagement activities, including participation in events and feedback received. Supports HR teams in managing engagement initiatives. | In-System Report (Daily) | Gudrun Neumann |
| 41 | Day-to-Day Reporting for Operational Tasks | Training Completion Report | People Management | Develop | Tracks the completion status of training programs, highlighting overdue and upcoming training sessions. Supports HR teams in managing training activities. | In-System Report (Live) | Gudrun Neumann |
| 42 | Day-to-Day Reporting for Operational Tasks | Absence Lobby | People Management | Manage | Provides individuals and line managers with oversight of absences. | In-System Lobby (Live) | Gudrun Neumann |
| 43 | Day-to-Day Reporting for Operational Tasks | Off Boarding Lobby | People Management | Exit | Details the status of exit processes, including completion of exit interviews and return of company property. Supports HR teams in managing the exit process. | In-System Lobby (Live) | Gudrun Neumann |
| 44 | Ad Hoc Self-Service Needs | Custom Recruitment Analysis | People Management | Recruit | Allows users to explore recruitment data, filter by various criteria, and generate custom insights. Supports ad hoc analysis and decision-making. | Self-Service (Custom) | Gudrun Neumann |
| 45 | Ad Hoc Self-Service Needs | Custom Engagement Analysis | People Management | Engage | Enables users to analyse engagement data, such as survey responses and participation trends. Facilitates ad hoc queries and insights. | Self-Service (Custom) | Gudrun Neumann |
| 46 | Ad Hoc Self-Service Needs | Custom Development Analysis | People Management | Develop | Allows users to explore development data, such as training effectiveness and skill assessments. Supports ad hoc analysis and decision-making. | Self-Service (Custom) | Gudrun Neumann |
| 47 | Ad Hoc Self-Service Needs | Custom Workforce Analysis | People Management | Manage | Enables users to analyse workforce data, such as performance metrics, absence trends, and expense patterns. Facilitates ad hoc queries and insights. | Self-Service (Custom) | Gudrun Neumann |
| 48 | Ad Hoc Self-Service Needs | Custom Exit Analysis | People Management | Exit | Allows users to explore exit data, such as reasons for leaving and exit interview feedback. Supports ad hoc analysis and decision-making. | Self-Service (Custom) | Gudrun Neumann |
| 49 | Day-to-Day Reporting for Operational Tasks | Expenses Lobby | People Management | Manage | Provides individuals and line managers with oversight of expenses and approvals. | In-System Lobby (Live) | Gudrun Neumann |
| 50 | Day-to-Day Reporting for Operational Tasks | Performance Management Report | People Management | Manage | Provides individuals and line managers with details around Performance Objectives, Performance Reviews and Check-ins. | In-System Report (Live) | Gudrun Neumann |
| 51 | Day-to-Day Reporting for Operational Tasks | Employee Data Report | People Management | Manage | Provides up-to-date information on employee details, including contact information, job roles, and employment status. Supports HR teams in maintaining accurate employee records. | In-System Report (Live) | Gudrun Neumann |
| 52 | Day-to-Day Reporting for Operational Tasks | On Boarding Lobby | People Management | Recruit | Details the status of joining processes, including completion of onboarding steps. Supports HR teams in managing the onboarding process. | In-System Lobby (Live) | Gudrun Neumann |
| 53 | Statutory Reporting / Board | Capability Development Summary | Capability Management | Develop Capabilities | Summarises key metrics such as training completion rates, skill assessments, and development program participation. Provides the board with insights into the effectiveness of capability development initiatives. | Power BI (Period) | Guy Tomlinson |
| 54 | Global / Regional Business Oversight | Development Program Dashboard | Capability Management | Develop Capabilities | Monitors the progress and effectiveness of development programs across regions, highlighting key metrics such as skill improvement and program completion rates. Helps business leaders manage talent development initiatives. | Power BI (Daily) | Guy Tomlinson |
| 55 | Ad Hoc Self-Service Needs | Custom Development Analysis | Capability Management | Develop Capabilities | Allows users to explore development data, such as training effectiveness and skill assessments. Supports ad hoc analysis and decision-making. | Self-Service (Custom) | Guy Tomlinson |
| 56 | Global / Regional Business Oversight | Workforce Planning Dashboard | Capability Management | Conduct Workforce Planning | Tracks workforce planning metrics across regions, highlighting key areas such as projected headcount, skill requirements, and workforce distribution. Helps business leaders manage workforce planning effectively. | Power BI (Daily) | Guy Tomlinson |
| 57 | Ad Hoc Self-Service Needs | Custom Workforce Planning Analysis | Capability Management | Conduct Workforce Planning | Enables users to analyse workforce planning data, such as headcount projections and skill gap analysis. Facilitates ad hoc queries and insights. | Self-Service (Custom) | Guy Tomlinson |
| 58 | Global / Regional Business Oversight | Resource Management Dashboard | Capability Management | Deploy Resources | Monitors resource utilisation metrics across regions, highlighting key areas such as allocation efficiency and utilisation rates. Helps business leaders manage resource deployment effectively. | Power BI (Daily) | Guy Tomlinson |
| 59 | Ad Hoc Self-Service Needs | Custom Resource Analysis | Capability Management | Deploy Resources | Allows users to explore resource data, such as allocation patterns and utilisation trends. Supports ad hoc analysis and decision-making. | Self-Service (Custom) | Guy Tomlinson |
| 60 | Statutory Reporting / Board | Workforce Planning Summary | Capability Management | Conduct Workforce Planning | Summarises key workforce planning metrics such as headcount forecasts, skill gaps, and succession planning. Provides the board with insights into future workforce needs and planning strategies. | Power BI (Period) | Guy Tomlinson |
| 61 | Statutory Reporting / Board | Resource Deployment Summary | Capability Management | Deploy Resources | Summarises key metrics such as resource allocation, utilisation rates, and project assignments. Provides the board with insights into resource deployment efficiency and effectiveness. | Power BI (Period) | Guy Tomlinson |
| 62 | Day-to-Day Reporting for Operational Tasks | Time Authorisation Lobby | Capability Management | Deploy Resources | Tracks the authorisation of timesheets and incomplete timesheets for employees within a Team. | In-System Lobby (Live) | Guy Tomlinson |
| 63 | Statutory Reporting / Board | Balanced Scorecard | Strategic Planning | Business Performance | Summarises key performance indicators across various business dimensions. Provides the board with a comprehensive view of business performance. | Power BI (Period) | Gareth Taylor |
| 64 | Global / Regional Business Oversight | Business Performance Review | Strategic Planning | Business Performance | Tracks the progress of business plans, highlighting key milestones and performance metrics. Helps business leaders monitor and adjust business strategies. | Power BI (Period) | Guy Tomlinson |
| 65 | Global / Regional Business Oversight | Investment Objectives | Strategic Planning | Investment Management | Monitors the status and performance of internal investments, including financial metrics and project outcomes. Supports operational decision-making and resource allocation. | Power BI (Daily) | Laura Symonds |
| 66 | Global / Regional Business Oversight | Horizon Scanning | Innovation & Research | Horizon Scanning | Shows trends and categorises horizon scanning articles selected by employees. Provides insights into emerging trends and potential opportunities. | Power BI (Daily) | Guy Tomlinson |
| 67 | Global / Regional Business Oversight | Innovation Projects | Innovation & Research | Innovation Projects | Shows the innovation ideas and projects underway and completed. Provides an overview of the progress and outcomes of innovation initiatives. | Power BI (Daily) | Guy Tomlinson |
| 68 | Day-to-Day Reporting for Operational Tasks | Project Manager Lobby | Innovation & Research | Innovation Projects | Provides an overview of all projects from initiation to pending closure. Gives an oversight of project finances, outstanding timesheets, customer invoices, supplier insights, project baselines and project KPIs. | In-System Lobby (Live) | Guy Tomlinson |
| 69 | Statutory Reporting / Board | Management Accounts | Financial Management | Management Accounts | This cloud-based Business Report is an indispensable tool for Financial Management to review and manage financial statements, including profit and loss accounts, for sound decision-making. | Power BI (Period) | Gareth Taylor |
| 70 | Global / Regional Business Oversight | Financial Close | Financial Management | Management Accounts | A series of reports to enable the close of the financial period covering hours, projects and expenses. | Power BI (Daily) | Gareth Taylor |
| 71 | Ad Hoc Self-Service Needs | General Ledger | Financial Management | Management Accounts | Allows users to explore the General Ledger financial information. | Self-Service (Custom) | Gareth Taylor |
| 72 | Statutory Reporting / Board | Treasury Analysis | Financial Management | Treasury | This cloud-based Business Report delves into the company’s financial holdings and liquidity, providing Financial Management with crucial insights for strategic fund allocation and investment decisions. | Power BI (Period) | Gareth Taylor |
| 73 | Global / Regional Business Oversight | Expense Analysis | Financial Management | Treasury | This Business Report provides detailed insights on employee expenses, offering Financial Management tools for policy enforcement and cost monitoring. | Power BI (Daily) | Gareth Taylor |
| 74 | Ad Hoc Self-Service Needs | Expenses | Financial Management | Treasury | Enables users to analyse the expenses accrued. | Self-Service (Custom) | Gareth Taylor |
| 75 | Global / Regional Business Oversight | Work in Hand | Financial Management | Project Accounting | A Business Report that outlines the current projects and work that the organisation has committed to, assisting Financial Management in managing project cash flows and recognising revenue appropriately. | Power BI (Period) | Gareth Taylor |
| 76 | Statutory Reporting / Board | Aged Debtors Analysis | Financial Management | Accounts Payable / Receivable | A Business Report that offers insights into overdue payments from customers, allowing Financial Management to track receivables and improve cash collection processes. | Power BI (Period) | Gareth Taylor |
| 77 | Global / Regional Business Oversight | Cost Centre Analysis | Financial Management | Accounts Payable / Receivable | A Business Report that offers a detailed examination of costs incurred by different centres within the organisation, enabling Financial Management to pinpoint areas of efficiency and overspend. | Power BI (Daily) | Gareth Taylor |
| 78 | Day-to-Day Reporting for Operational Tasks | AP / AR Lobby | Financial Management | Accounts Payable / Receivable | Shows financial lobby for AR / AP roles. | In-System Lobby (Live) | Gareth Taylor |
| 79 | Ad Hoc Self-Service Needs | Cost Centres | Financial Management | Accounts Payable / Receivable | Allows users to explore costs associated with Cost Centres. | Self-Service (Custom) | Gareth Taylor |
| 80 | Global / Regional Business Oversight | Health & Safety Report | HSEQ & Security Management | Health, Safety and Environment | Summarises key health and safety metrics such as incident rates, near misses, and compliance status. Provides insights into workplace safety and compliance. | Power BI (Daily) | David Bright |
| 81 | Day-to-Day Reporting for Operational Tasks | H&S Lobby | HSEQ & Security Management | Health, Safety and Environment | Provides managers with real-time oversight of health and safety incidents, actions, and compliance status. Supports proactive management of workplace safety. | In-System Lobby (Live) | David Bright |
| 82 | Statutory Reporting / Board | Initiatives Portfolio Overview | IT Management | Enterprise Architecture and Change Management | Provides an overview of the IT initiatives portfolio, highlighting key metrics such as project status, resource allocation, and financial performance. Helps business leaders manage the IT initiatives portfolio effectively. | Power BI (Daily) | David Bright |
| 83 | Global / Regional Business Oversight | Initiatives Roadmap | IT Management | Enterprise Architecture and Change Management | Tracks the progress of IT initiatives, highlighting key milestones and timelines. Provides business leaders with an overview of ongoing and planned IT projects. | Power BI (Daily) | David Bright |
| 84 | Global / Regional Business Oversight | Change Requests | IT Management | Enterprise Architecture and Change Management | Tracks the status and progress of change requests, highlighting key metrics such as approval rates and implementation timelines. Helps business leaders manage change effectively. | Power BI (Daily) | David Bright |
| 85 | Global / Regional Business Oversight | Integration Metrics | IT Management | Business Productivity Services | Monitors the integration of IT systems and applications, highlighting key metrics such as integration success rates and performance. Helps business leaders ensure seamless integration of IT systems. | Power BI (Daily) | Guy Tomlinson |
| 86 | Global / Regional Business Oversight | Software Analysis | IT Management | Business Productivity Services | Summarises key metrics related to software usage, performance, and compliance. Provides insights into software effectiveness and areas for improvement. | Power BI (Daily) | Guy Tomlinson |
| 87 | Global / Regional Business Oversight | Intranet Adoption | IT Management | Business Productivity Services | Tracks the adoption and usage of the intranet across the organisation. Helps business leaders understand the effectiveness of the intranet in facilitating communication and collaboration. | Power BI (Daily) | Guy Tomlinson |
| 88 | Day-to-Day Reporting for Operational Tasks | M365 Usage and Adoption Lobby | IT Management | Digital Workplace Services | Provides real-time oversight of Office usage and adoption metrics, highlighting key areas such as user engagement and feature utilisation. Supports proactive management of Office adoption. | In-System Report (Live) | Guy Tomlinson |
| 89 | Day-to-Day Reporting for Operational Tasks | M365 Copilot Usage and Adoption Lobby | IT Management | Digital Workplace Services | Provides real-time oversight of Copilot usage and adoption metrics, highlighting key areas such as user engagement and feature utilisation. Supports proactive management of Copilot adoption. | In-System Report (Live) | Guy Tomlinson |
| 90 | Global / Regional Business Oversight | Business Report Usage | IT Management | Data & Analytics Services | Tracks the usage and adoption of business reports across the organisation. Provides insights into report effectiveness and areas for improvement. | Power BI (Daily) | Guy Tomlinson |
| 91 | Statutory Reporting / Board | IT Services Overview | IT Management | IT Services | Provides a comprehensive overview of IT performance over the year, including system uptime, incident response times, user satisfaction, and major IT initiatives. Helps the board understand the overall effectiveness of IT operations and identify areas for improvement. | Power BI (Daily) | David Bright |
| 92 | Global / Regional Business Oversight | Network Security | IT Management | IT Services | Monitors network security metrics, highlighting key areas such as threat detection, response times, and compliance. Helps business leaders ensure the security of the IT infrastructure. | Power BI (Daily) | David Bright |
| 93 | Global / Regional Business Oversight | IT Carbon Emissions | IT Management | IT Services | Tracks the carbon emissions associated with IT operations, highlighting key metrics such as energy consumption and emission reduction efforts. Helps business leaders understand and manage the environmental impact of IT operations. | Power BI (Daily) | David Bright |
| 94 | Day-to-Day Reporting for Operational Tasks | Service Management Lobby | IT Management | IT Services | Provides users and IT professionals with tools to manage IT services, including incident management, service requests, and performance monitoring. Supports effective IT service management. | In-System Lobby (Live) | David Bright |
| 95 | Day-to-Day Reporting for Operational Tasks | IT Cost Management (M365 and Azure Portal) | IT Management | IT Services | Tracks the costs associated with M365 and Azure services, including licensing, usage, and support. Provides insights into cost optimisation opportunities and budget management. | In-System Lobby (Live) | David Bright |