
(Redrafted for Alignment with Data Operations Plan)
Key Takeaways
- Accuracy and Timeliness: Reports must use reliable, up-to-date data, refreshed at least every 24 hours.
- Data Marts: Serve as the foundation for consistent and reusable datasets across reports.
- Common Data Model (CDM): Ensures consistency and coherence by standardising data structure and relationships.
- Global Currencies: Consolidation and currency handling must align with global reporting standards.
- Validated Transformations: Enterprise-level data aggregations should occur in Data Marts to ensure consistent usage. Summation of data will typically be conducted in the Power BI report.
- Source Control: Version control ensures robust data governance for Data Marts, datasets, and reports.
- Historical Trends: Key data is periodically snapshot for trend analysis.
7.1 Data Modelling and Transformation Requirements
The following requirements have been identified relating to Data Modelling and Transformation:
- Data Accuracy and Timeliness: Reports must present accurate and up-to-date information from reliable sources. Ensure that data refresh rates align with business needs for timeliness.
- Performance and Scalability: Reports should load efficiently, even with large datasets. The system must scale to accommodate increased data volume over time.
- Cross-Functional Integration: The reporting system should seamlessly integrate data from various business functions. Ensure consistency and coherence in cross-functional reporting.
7.2 Reporting Framework and Data Transformation
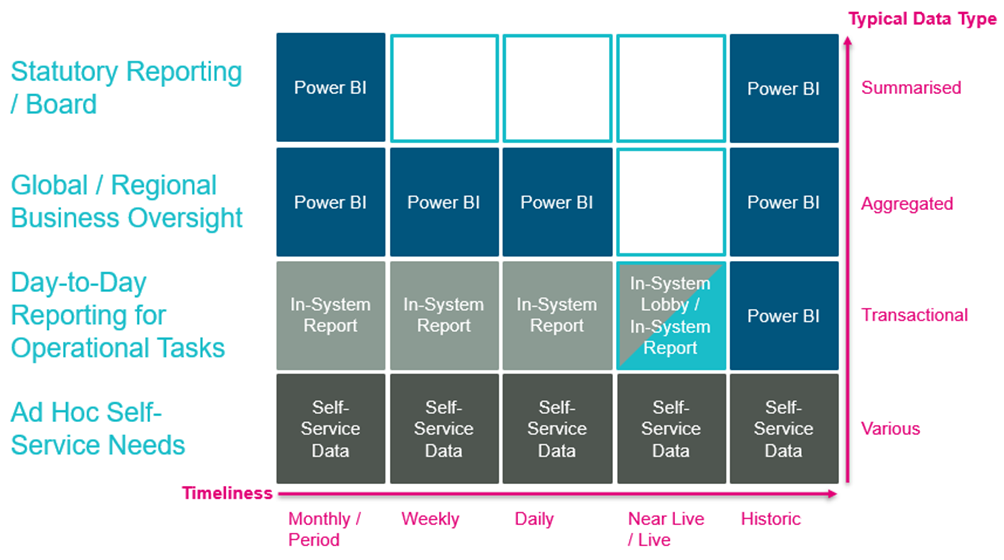
The Reporting Framework (repeated at Figure 7.1) identified 3 typical data types used in various levels of reporting. It is recognised that elements of all 3 are valid for all use cases.
7.3 Data Structure
Within BMT, we typically utilise data from more than one source for reporting. Pipelines are used within the Data Warehouse or as feeds into Datasets or Data Marts. Reports are fed from Data Marts (or data models) in ways that:
- Enable multiple reports to work simultaneously on the same data.
- Allow datasets to be updated incrementally or in bulk, depending on the source and volume.
- Support multiple report developers.
- Reduce the risk of BI/Report Developers altering the data model.
Data Modelling and Transformation Principle 1 – Data Marts for Consistency
To improve reuse, assure quality, and speed up development, all reports will make use of datasets from Data Marts within the Data Warehouse. Data Marts are specified, and the Data Engineering team and Data Source SMEs source the required data to meet reporting needs.
Pipelines, datasets, and reports will be refreshed at an agreed schedule, typically once daily. Reports will clearly identify the last data refresh time.
Data Modelling and Transformation Principle 2 – Snapshot Data
Determine reporting frequency based on stakeholders’ needs. Establish regular reporting schedules for consistency and timeliness, with a minimum timeliness of 24 hours for complete refreshes. Users needing more immediate data should access application-specific reports or dashboards.
7.4 Common Data Model
The Common Data Model (CDM) facilitates the systematic analysis of disparate operational databases by:
- Standardising organisational data into a consistent format.
- Orchestrating data for ingestion (staging) and storage (Data Warehouse).
- Creating consumable Data Marts for:
- Business intelligence, data science, and analytics.
- Integrating disparate data sources.
- Rapid custom application development.
Business Architecture of CDM:
- Entities: Each CDM element corresponds to a key entity (e.g., Project, Employee, Customer).
- Key Attributes: Define essential information for each entity (e.g., Name, Date of Birth for Employees).
- Key Dimensions: Summarise and contextualise data for analysis (e.g., Job Family, Grade for Employees).
- Key Relationships: Identify connections between datasets (e.g., linking a Project Manager to Employee data).
- Key Facts: Represent measurable data (e.g., hours reporting, utilisation).
Data Modelling and Transformation Principle 3 – Common Data Model
All Data Marts will align with the BMT CDM approach to standardise data structures across systems.
7.5 Consolidation and Handling Global Currencies
Consolidating data across regions must include consistent handling of global currencies. Metadata tagging and lineage tracking will ensure accurate currency conversions and reporting consistency.
Data Modelling and Transformation 6 – Currency Handling in Data Warehouse
Includes provisions for consistent handling of multi-currency data and metadata tracking for accurate exchange rate management. With the Data Warehouse and Data Mart views transferring local and consolidated currencies for reports. Where a further currency conversion is required this will be handled within the Business Report itself.[SW1]
[SW1]I’ve added this section. Can you check it please?
7.6 Transformation of the Data
Data transformations, of commonly used metrics, primarily occur at the Data Mart level to ensure consistency across reports. Transformations applied directly within reports are not validated for enterprise use but may be acceptable for local purposes. While summations and aggregations are commonly performed in Power BI for visualisation purposes, Data Marts can be enhanced to pre-aggregate or summate data.
These pre-computed results can:
- Improve the performance of reports by reducing runtime calculations.
- Enable advanced aggregation methods (e.g., weighted averages, forecasted totals) that standard tools may not easily support.
Incorporating aggregations into Data Marts ensures consistency, scalability, and alignment with strategic insights.
Machine Learning (ML) models integrated into the Data Warehouse infrastructure can generate summarised datasets, these are incorporated into the Data Marts as an additional data source.
Data Modelling and Transformation Principle 4 – Enterprise Data Transformations
Enterprise-level data aggregations should occur in Data Marts to ensure consistent usage. Summation of data will typically be conducted in the Power BI report. Where a separate model, such as ML, is used to predict or prescribe a likely outcome this data will form an additional data source.[SW1]
[SW1]The draft text was contradictory. We said that the all enterprise-level data transformaiton happen in a view expect for aggregations or summations that happen in PowerBI. I’ve amended the key takeaway, is that correct now?
7.7 Source Control
Data Marts
Configuration and Version Control:
Data Mart views are configured with SQL code snippets managed under strict version control within the Data Warehouse.
- Source Control Repository: All SQL code is stored in a centralised DevOps-based repository to track changes, maintain history, and enable collaboration.
- Branching and Approval Processes: Development follows a branching strategy (e.g., feature, development, and production branches), with mandatory peer reviews and automated quality checks before merging into production.
- Deployment Pipelines: Changes to Data Mart views are deployed using automated CI/CD pipelines, ensuring seamless updates to production environments with minimal downtime.
Documentation:
Each Data Mart view is accompanied by comprehensive metadata and documentation, including:
- Purpose: The business question(s) it addresses.
- Source Tables: Detailed mapping to the source tables and fields.
- Transformation Logic: A clear explanation of all transformations applied.
- Ownership: The accountable team or individual.
Audit Trails:
A robust audit trail captures all changes, including who made the changes, when, and the reasons for the update.
Role of EXEC get.myview in the DataMart Source Process
Centralised View Retrieval:
get.myviewacts as a stored procedure or function that retrieves pre-configured views or queries from a central repository.- Simplifies the process of accessing DataMart views by abstracting away the underlying SQL logic and transformations.
- Ensures consistency by enforcing the use of pre-approved query templates.
Configuration Control
- Views managed through
get.myvieware likely stored and version-controlled in the database or alongside the Data Warehouse’s configuration management process. - This approach ensures all changes to the DataMart views go through a controlled process, maintaining integrity and traceability.
Simplified Maintenance
- By encapsulating query logic within a procedure like
get.myview, updates or optimisations to the view logic can be made in a single location without requiring changes to consuming applications or downstream systems.
Integration with DataMart Processes
get.myviewcan be invoked as part of the pipeline or DataMart orchestration process to dynamically retrieve views based on parameters such as schema, view name, or user role.
Enhanced Security and Governance
- EXEC
get.myviewmethod allows for centralised control over who can execute which views, as permissions can be managed at the procedure level. - Audit trails can be implemented to log when and by whom the procedure was executed.
Documentation and Standardisation
- Using a procedure like
get.myviewenforces a standardised method for accessing views, which simplifies documentation and reduces onboarding time for new team members. - The procedure parameters and outputs can be documented, ensuring clarity for developers and analysts.
Business Reports
Where a report is generated by the central BI Team the PBIX or report file is to be held in the Business Intelligence Team Site.
Where a report is generated by another team the PBIX file is to be held in a suitable Teams environment.
In-System Reports
Where an in-system report is created or modified the code snippet used with be version controlled and held in the G-MIS project DevOps repository.
In-System Lobby
Where an in-system lobby has elements that are created or modified the code snippet used with be version controlled and held in the G-MIS project DevOps repository.
7.8 Data Warehouse Historic Data
Periodic snapshots of key data tables enable historical trend analysis. Only dataset views used in reports are retained to provide meaningful trends while minimising storage overhead.
Refer to: Get myHistory
7.9 In-System Reporting
Where available, in-system reports or dashboards are used for displaying data. These rely on the application’s standard data model, with minimal additional transformation needed.