
5.1 Reporting Tools and Technologies Requirements
Reports should be accessible and optimised for viewing on desktop and mobile devices. Ensure a responsive design for a consistent user experience across devices.
5.2 Reporting Framework and Tools
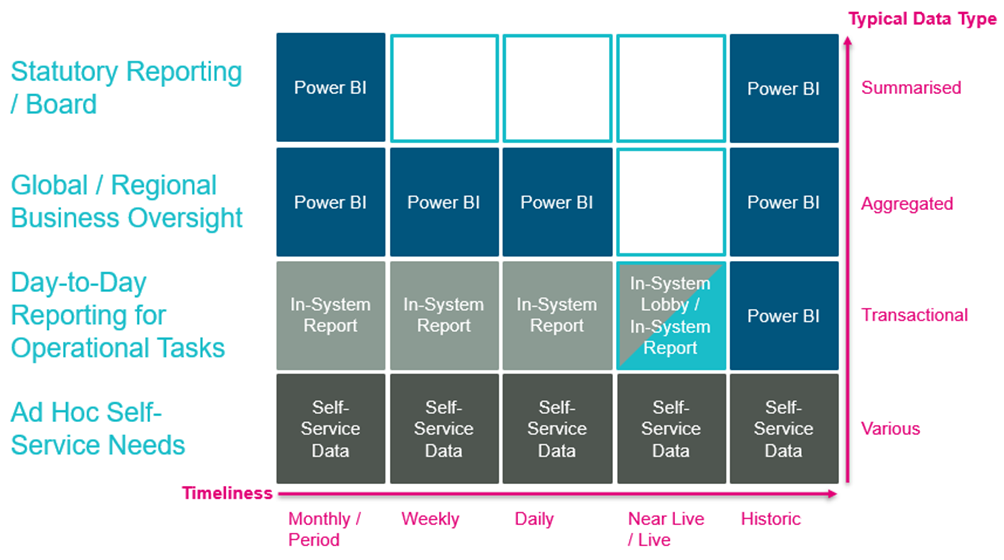
The Reporting Framework (repeated at Figure 6.1) identified 4 typical reporting methods:
5.3 In-System Data Reports and Lobbies
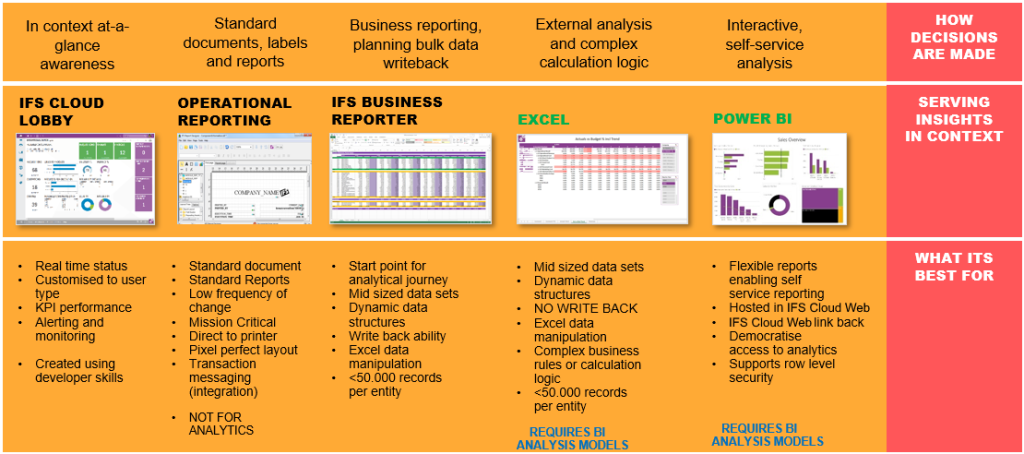
For many users and business roles the primary means of accessing data will be directly from the Enterprise Application itself. Where available such as in IFS Cloud in-system reports will enable users to view tabular data on screen and export to CSV or XLSX format for further analysis or sharing. In-System Lobbies typically allow less manual export but are useful to interact with the application and workflow steps directly such as in IFS Cloud. The available standard options for IFS Cloud are shown at Figure 6.2
Reporting Tools Principle 1 – IFS Cloud Reporting and Analysis Solutions
Where available we will utilise IFS Cloud standard reporting and analysis solutions to support our operational reporting needs from IFS Cloud.
5.4 Power BI Data Visualisation
Our office technologies are all based around a Microsoft Technology Stack whether this be in Microsoft 365 or Azure Cloud Services. This technology stack provides us a unifying on-premises and cloud infrastructure underpinned by a robust security model to protect our data and that of our customers.
Reporting Tools Principle 2 – Microsoft Technologies for Business Reporting
Due to the wide range of tools on offer across the market we will primarily use Microsoft tools as part of our infrastructure. Where there is a reason to deviate for cost-effectiveness, a unique feature or some other compelling reason provided the security of our data is ensured we will consider alternatives a case-by-case cost benefit analysis.
The overall use of Microsoft Tools for organisation-wide content distribution is shown at Figure 6.3 and is based on the standard Microsoft Enterprise BI usage scenario.
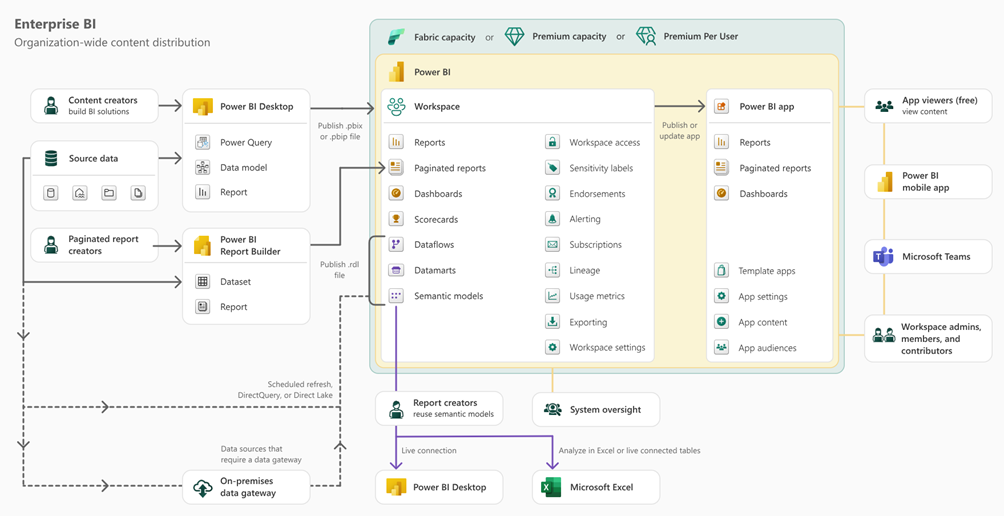
Figure 6.3 depicts the following user actions, tools and features which was modified from the example Microsoft scenario. This setup enables effective development and distribution of Power BI data visualisations in the form of Business Reports.
5.5 Self-Service Data
For a small number of business roles there is a requirement to perform ad hoc analysis on the underlying datasets. We support this in two ways:
- Utilising the configuration in Figure 6.3 report creators can utilise Power BI desktop or Microsoft Excel to connect directly to the Workspace Semantic Models to perform further analysis.
- For IFS Cloud we will enable the use of IFS Business Reporter for reporting and analysis roles to conduct ad hoc analysis directly on IFS Cloud data.
5.6 Data Storage and Computing
To support the reduction in Scope 2 emissions from our premises we seek to make use of cloud hosted services in the future. As well as having a smaller environmental footprint these services are more effective for us to collaborate via particularly with a highly mobile and hybrid workforce. Utilising cloud services also provides access the High-Performance Compute (HPC) capabilities that would not be cost effective for all parts of BMT to be able to run predictive analytics.
Reporting Tools Principle 3 – Microsoft Azure for Data Lakes, Warehouses and Marts
We will build all Data Lakes, Data Warehouses and Data Marts for Business Information in the Azure Cloud. Initially this is built upon Microsoft Azure Data Factory and Azure Synapse but we will continuously review the latest platforms and continually seek to migrate to reduce technical debt in the medium to long-term.