
8.1 Report Design Guidelines Requirements
Users should be able to drill down into detailed data for deeper insights. Provide interactive features for data exploration and analysis.
8.2 Style Guide
A standardised reporting layout, structure and use of visuals is essential to enable users of Power BI reports across BMT seamlessly move between reports. To achieve this a Reports Style Guide based on best practice for User Experience (UX) design and corporate guidelines is available from the Business Intelligence Team.
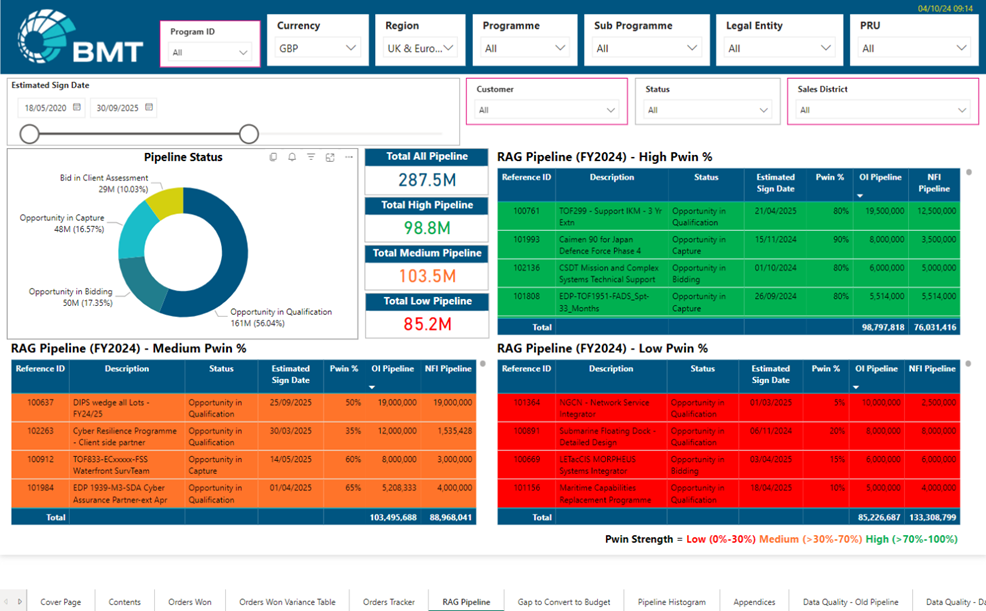
In the example at Figure 8.1 a consistent approach to slides to enable users to drill down for deeper insights is achieved. Utilising the interactive features of the Power BI users can conduct their own data exploration and analysis.
Business Owners requiring reports should consider the business needs and the user experience when specifying their reports. The Business Intelligence Community have experts in BI Development to support with report layouts and visualisations. The aim is to have the smallest number of individual report pages and to utilise slicers and other ways to explore and analyse the data.
Report Design Principle 1 – All Reports will utilise the Report Style Guide and being developed by the central Business Intelligence Community
To provide a common approach across business reporting and to reduce the number of duplicate reports all reports will be developed by the central Business Intelligence community. The BI community comprises of subject matter experts and BI developers with access to the correct tools and style guides to develop consistent reports for data consumers.